Download
1 / 1
10 likes | 139 Views
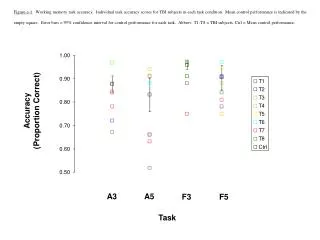
"To bite, or not to bite“: Perceived causality in the perception of negative parts. β. α. Patrick Spröte & Roland W. Fleming | Justus-Liebig Universität Gießen. The larger the missing portion, the more ‘bitten‘. The more concave, the more ‘bitten‘. Background.

E N D
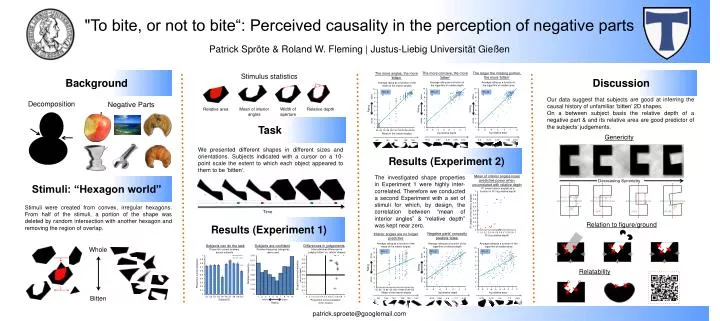
"To bite, or not to bite“: Perceived causality in the perception of negative parts β α Patrick Spröte & Roland W. Fleming | Justus-Liebig Universität Gießen The larger the missing portion, the more ‘bitten‘ The more concave, the more ‘bitten‘ Background The more angles, the more ‘bitten‘ Discussion Stimulus statistics Average rating as a function of the mean of the interior angles Average rating as a function of the logarithm of relative area Average rating as a function of the logarithm of relative depth R²=.90 R²=.76 R²=.63 bitten Our data suggest that subjects are good at inferring the causal history of unfamiliar ‘bitten’ 2D shapes. On a between subject basis the relative depth of a negative part & and its relative area are good predictor of the subjects’ judgements. bitten bitten Decomposition Negative Parts Rating Width of aperture Relative area Mean of interior angles Relative depth Rating Rating whole Task whole whole Mean of the interior angles log relative area Genericity log relative depth 60° 108° 135° 152° 90° -5.6 -3.74 -2.73 -1.64 -0.54 -5.31 -3.67 -2.51 -0.95 0.72 We presented different shapes in different sizes and orientations. Subjects indicated with a cursor on a 10-point scale the extent to which each object appeared to them to be ‘bitten‘. Results (Experiment 2) The investigated shape properties in Experiment 1 were highly inter-correlated. Therefore we conducted a second Experiment with a set of stimuli for which, by design, the correlation between “mean of interior angles” & “relative depth” was kept near zero. Mean of interior angles loses predictive power when uncorrelated with relative depth Stimuli: “Hexagon world” Decreasing Symmetry R² (mean interior angles) as a function of R² (log relative depth) Stimuli were created from convex, irregular hexagons. From half of the stimuli, a portion of the shape was deleted by random intersection with another hexagon and removing the region of overlap. R² (mean of the interior angles) Results (Experiment 1) Relation to figure/ground Negative parts‘ concavity predicts ‘bites‘ Interior angles are no longer predictive R² (log relative depth) Whole Average rating as a function of the mean of the interior angles Average rating as a function of the logarithm of relative depth Average rating as a function of the logarithm of relative area Subjects can do the task Subjects are confident Differences in judgements Proportion correct answers across subjects Relative frequency categories were used Interindividual differences in judging ‘bitten‘ vs. ‘whole‘ shapes R²=.10 R²=.59 R²=.33 bitten bitten counting vertices concave = bitten mean Rating Rating Relatability Proportion correct answers Relative frequency Proportion correct answers (whole shapes) whole whole Bitten Mean of the interior angles log relative area log relative depth 90° 120° 129° 135° 140° -5.22 -3.88 -2.6 -1.77 -0.42 -8.76 -5.75 -3.4 -1.2 -0.64 108° Subject ID whole bitten Proportion correct answers (bitten shapes) Rating patrick.sproete@googlemail.com Time