Download
1 / 43
430 likes | 622 Views
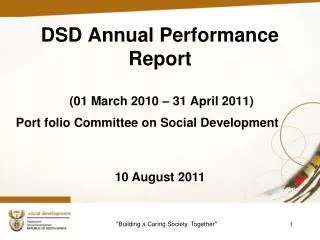
Port Sector: Issues & Challenges . Arvind Kumar* Senior Adviser (TR) Ministry of Road Transport & Highways February 2, 2012, Mount Abu Forum of Indian Regulators (FOIR) * Views are personal and do not necessarily reflect the views of the organization to which the author belongs.

E N D
Port Sector: Issues & Challenges Arvind Kumar* Senior Adviser (TR) Ministry of Road Transport & Highways February 2, 2012, Mount Abu Forum of Indian Regulators (FOIR) *Views are personal and do not necessarily reflect the views of the organization to which the author belongs
Overview: India’s Port Sector • India’s seaborne trade 95% by volume & 67% by value • Length of the coastline 7,517 km - 9 maritime States & 5 UTs ( including 2 island groups) • Parallel competing port management & legal Systems - 12 under Major Ports Act, 1963 - 1 (Ennore) under Company Act - 184 Non-major ports • Portlegislation & Structure - Indian Ports Act, 1908 allows Maritime States to set up their own port systems - Major Port trust Act, 1963, regulates 12 major ports. • Major Ports fall under operational & financial control of M/O shipping & subject to tariff regulation by Law • Minor ports: under State Maritime Boards & free from formal tariff regulation
Growth Dynamics: India’s Port Sector Growth dynamics of cargo traffic (2000-2011) • Overall annual growth (major & non-major) 9.2% • Major ports (7.3%) & Non major ports (13.7%) • As a consequence share of non major ports in cargo handled rose from 24% in 2000-01 to 36% in 2010-11 • Capacity utilisation around 90% at Major ports • Highest annual growth in container traffic (15%) • Containerisation at about 2/3rd of general cargo compared to global levels 80% plus. • Container traffic has grown, but is uneven in pace, demand centred in North West Hinterland (60%) • Indian ports have low draft, makes access of large bulk vessels problematic. Entails higher unit shipping cost for low value items. • Leads to higher turnaround time & small parcel size.
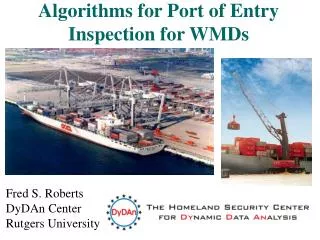
Port Call Charges (US$) (24Hrs stay of 50000 GRT vessel 2009-10 ) Source: Task Force on Transaction Cost in Exports, 2011, Ministry of Commerce and Industry
TEU per meter of Berth Global Median=945
Productivity of Gantries (Moves/Hr), 2009-10 Global median mover per hour 30
Impact of External Factors-Dwell Time Source: Based on Task Force on Transaction Cost in Exports, 2011, M/o Commerce and Industry
Moving Containers: Distribution of costs • The cost of moving a container fall into five major categories and the distribution of costs (as percentage of total costs) of moving containers is as follows: - inland transport (25%) - the ship/ocean freight costs (23%) - ports and terminals (21%), including stevedoring - the containers (18%), including maintenance - other costs, including container repositioning (13%) Source: Jean-Paul Rodrigue, Hofstra University; Martin Stopford, is the drive for ever bigger container ships irresistible? Lloyd’s list shipping forecasting conference, April, 2002 quoted in Fairplay.com.uk
When to Regulate? • Market power • Imperfect & Asymmetric information: Operator (Agent) has an informational advantage over the Government/Regulator (Principal) • Externalities: occur when production or consumption of goods/services impose costs/benefits on others which are not reflected in the prices charged for the goods & services being provided • Joint provision & consumption
Starting Point: Efficient Markets P S = Marginal Cost Pc Pc = Marginal Revenue Optimum: MR= MC D Qc Q Social Welfare = ConsumerSurplus + Producer Surplus
Philosophy of Regulation • Case for Economic Regulation exists when: • Activity or industry has elements which bestow advantages of natural monopoly, it occurs when: • Industry/Activity has large sunk costs and falling average costs • Significant barriers to entry • Locational advantages which bestow near monopoly advantages on the operator
The economic Characteristics of Port Infrastructure • The basic port infrastructure is: - indivisible & requires large sunk costs -long lived -constructed in a specific space for a specific use • => Perfect conditions for the existence of scale economies • The most obvious difference with other public services: - Multiple services associated with the port infrastructure • This multitasking dimension matters a lot when thinking about economic regulation, including pricing - the infrastructure provide a service: you can charge a price - the infrastructure is an input: you can charge a price
Why Tariff Regulation in Ports • Port Trusts (PTs) can not regulate their own tariffs or of Terminal Operators due to • Conflict of Interest • Being Competitors • Need to safeguard user’s interests • Therefore, the need for 3rd Party Neutral Regulator
Charter of TAMP To fix scale of rates : • For services rendered by the ports • Rentals for use of port trust properties • Fix charges for services rendered by port operators (BOT, concessionaries etc. under MPT • Prescribe conditions for services rendered by Port Trusts/operators. Guiding Principles • Safeguard the interest of port users; • Just and fair return to operators • Promote economy in use of resources & efficiency
Tariff Guidelines 2005: Approach • Anchored on cost plus basis • Cost as per estimate for future & ROCE determine tariff • Revenue share/royalty not treated as cost - Except in cases prior to July 29, 2003 subject to a maximum of second lowest bidder • ROCE is on sum of net fixed assets plus working capital • Return on capital allowed 16% as of now - full ROCE allowed for capacity utilization of 60% & above.
Tariff Guidelines 2005 Approach • Tariff approved by TAMP valid for 3 years • Rates fixed by TAMP are ceiling rates -Ports/operators enjoy flexibility to offer rebates • Tariffs fixed are -Vessel related (port dues, berth hire on GRT basis) -Pilotage sliding rates (higher for higher GRT) -Cargo related (wharfage rates) based on cargo handling • Concessional tariff for coastal cargo/containers/vessels -60% of normal tariff applicable -coal, POL & iron ore are not eligible.
Tariff Guidelines 2005:Issues • Information intensive exercise • Too much emphasis on individual operator’s profitability • Weak incentives for efficiency • Disallowance for revenue share in tariff and its long term effects • Partial pass through of royalty/revenue share for private terminals which came prior to July 2003.
Tariff Guidelines 2008 • Simple & Norm based • No provision for midterm review • Unchanged Tariff for 30 years • May not encourage regular investment by operators or • May bestow windfall gains on operators if any change in planning/parameters • Norms do not cover all areas of operations
Upfront Tariff Guidelines 2008 • Committee on infrastructure found that combining cost plus model of tariff and revenue share model of bidding was untenable • Recommendations • Upfront tariff • Uniform tariff cap at the same port • Normative cost based with fair return on capital • Capacity utilisation of 75% • Tariff caps to be reviewed once every five years to adjust for any unforeseen events • Tariff indexed to 60% of WPI variation • Guidelines for upfront tariff setting for PPP projects • Notified in the Gazette on 26.2.2008
Salient Features of 2008 Guidelines • TAMP to fix upfront tariff cap before bidding based on proposals from major ports • Bid document to incorporate the upfront tariff • Tariff cap set for a port would be applicable to all projects bid out subsequently for identical cargo during the next five years • Approach – Normative cost based approach • Estimated capital and operating cost based on norms prescribed • Fair rate of return on capital employed (presently @ 16%) • Annual indexation of upfront tariff • 60% of the variation in the WPI of the relevant year • TAMP to review tariff caps • Once in five years for extra-ordinary events • Revised tariff caps applicable to subsequent PPP projects
Fixation of Upfront Tariff • Capacity • Tariff to be fixed with reference to the optimal capacity irrespective of traffic forecast • Indicative norms for capacity are prescribed in the guidelines for handling containers, iron ore, coal, liquid bulk and multipurpose cargo • Optimal capacity is 70% of the maximum capacity • Lower of the quay capacity and stack yard capacity is to be adopted
Current Issues: Port Tariffs • Tariff Models • Tariff Guidelines 2005 • Tariff Guidelines 2008 • Non Major Ports outside tariff regulation • Inadequate Statutory Powers • No power to compel submission of information & documents • No power to enforce its Orders
Rate of Return Regulation • Tariffs are set to generate Annual Revenue Requirement enough to recover operating costs and fair/predetermined return on capital; • In essence limits the level of profit to be earned • Operator’s cost are reviewed & costs deemed unnecessary eliminated. • Problem in determining allowable costs • No incentive to operate efficiently • Operator may over invest
Guiding Principle Regulator sets regulated rates or tariffs for the regulated entities so that the regulated rates allow the entity to earn a revenue that covers the “justified costs” of their operation, that is the costs that are necessary, unavoidable and reasonable and offer a predetermined return on assets to render regulated service at a predefined level of quality Revenue Requirement=Total Cost=Variable Cost+(Rate level*Rate Base)
Pitfalls of Cost Plus Regulation • Motivation for over-investment (increased rate base) – ‘gold plating’ • No motivation to increase productive efficiency • Continuous pressure for price increase • No incentive for selection of right equipment • Information asymmetry at the regulator’s side: - no up-to-date operating cost information - no data on future business plans (investments, cost-reduction, etc.), - obscure picture on demand side.
Port pricing Models: Theoretical Perspective • Presence of economies of scale => problem to implement a first best pricing policy (price equal to marginal cost) => not possible to recover investment costs. • Second-best alternatives, common to other transport sectors, are: - Average-cost pricing, - Two- part tariffs, - Long-run marginal cost pricing, and the use of rental fees from concessionaires.
Port pricing Models: Theoretical Perspective • This possible alternative: long-run marginal cost (LRMC) • It is defined as: short-run marginal cost (SRMC)+ the marginal cost of capacity (MCC) LRMC = SRMC + MCC • which keeps the idea of social optimality, and at the same time, achieves full cost recovery • The idea could be: • SRMC: paid by the ships • MCC: paid by port services operator
Regulation Versus Market Failure • Are there regulatory errors in setting prices? • Is regulation intrusive and costly? • Does it discourage long term investment? • Too much focus on short term cost/prices • Is regulatory innovation desirable
Issues in Port Sector • Why are vessel related charges higher at Indian Ports. • What makes high turnaround time and pre berthing detention at Indian Ports - lower levels of technology & lack of coordination amongst stakeholders • How to make Indian Port sector vibrant? - Change in institutional structure(Trusts versus Corporatized entity) - Does ownership matter ? All Ports in Europe (except in the UK),Dubai, Singapore etc owned by the State - Synergy with trade and industrial policy (SEZs and FTZs). • Are port related charges villain of the piece? - No, port related charges account for around 10-15% of total logistics cost. - High inland transit costs, connectivity constraints influence cargo flows/costs.
Issues: Port Sector • Captive versus common carrier terminals • Inter port and intra port competition • Inter port competition constrained by hinterland economic activity, connectivity & inland transit costs • Intra port competition can serve to mitigate the pricing power • Intra port competition may be ineffective in situations where ownership is concentrated • Financing of port infrastructure • Land acquisition and environmental clearance - long gestation period for green field port projects (15 years) • Scale of operations at Indian Ports - Fragmented and small compared to China - Combined throughput at Major Indian Ports barely matches that of Shanghai alone. • Draft limitation restricts access of large vessels to Indian Ports resulting in: - More number of ship calls leading to congestion - Higher demand for berthing
Port System Efficiency is the Key Intangible Factors • Management practices • Customer satisfaction • Personnel quality & motivation Hinterland • Level of Economic Activity • Road/Rail Network • Material Access • Feeder Services Terminal Efficiency Port Performance - Sum of parts! Efficiency improvements should target the entire sphere of activities and result in increased competitiveness • Crane productivity • Yard equipment planning & productivity • Gate productivity • Equipment Utilization • No. of berths • Port Charges Technology • Port Equipments • Software applications • IT based custom & security • Communication system Physical Features of Port • Master Plan & port capacity • Level of congestion • Ability to handle large ships • Geographical location