Download
1 / 41
420 likes | 829 Views
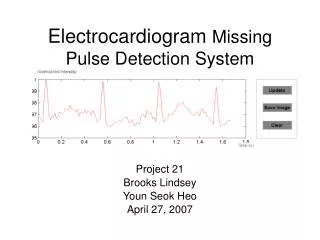
Electrocardiogram Missing Pulse Detection System. Project 21 Brooks Lindsey Youn Seok Heo April 27, 2007. Introduction. High incidence of undiagnosed heart disease Reluctance to seek medical attention EKG allows quick diagnosis of many heart conditions. Project Objectives.

E N D
Electrocardiogram Missing Pulse Detection System Project 21 Brooks Lindsey Youn Seok Heo April 27, 2007
Introduction • High incidence of undiagnosed heart disease • Reluctance to seek medical attention • EKG allows quick diagnosis of many heart conditions
Project Objectives • Provide at-home EKG monitoring • Low-cost device • Utilize user’s personal computer • Immediately identify missing beats • Healthy heart statistics
Features • Wrist-to-wrist measurement • USB interfacing • Heart rate computation • Missed beat detection • Displayable and storable data
Major subsystems • EKG Detection Circuit • Filter extraneous noise • Amplify weak signal • Interfacing: Analog to USB • A/D conversion • Data transfer into Windows via USB • Software • Matlab-based • Data Analysis • Data display • Storage and exporting of data
Power Supply Circuit EKG Signal Conditioning Unit Pulse Detection Circuit Electrodes PIC (16F877A) Analog to Digital Converter Microcontroller USB Personal Computer Interface Data Analyzing Software PC Block diagram – original design
EKG Circuit - Design • 2 High Pass and Low Pass Filters • HPF: 1.06 Hz • LPF: 28.4 Hz • 1 instrumentation amplifiers (AD622) • low DC offset • low drift • low noise • high open-loop gain
Protection Resistors • We used two 220KOhm resistors for the protection resistors. • . Right Input 220 KOhm Left Input 220 KOhm
Protection Resistors • For the safety, we needed to make sure the current to person was less than 10 micro amps. • We measured actual voltage using voltmeter. Voltage across each current limiting resistor: 0.1V Current= 0.1 V / (220x10^3)=0.45 micro amps. • As long as the person is not directly connected to +9V or -9V, so it should be more than enough
Gain http://www.analog.com/UploadedFiles/Data_Sheets/AD622.pdf
Gain Resistor We used the gain resistor 47.5 ohms. Rg= 47.5 ohms G= 50.5KOhms/ 47.5Ohm +1 G= 1064.2 So the gain is 1064.2.
Second Order High Pass filter C1= 0.1 uF C2= 0.1 uF R1= 1.5 Mega Ohm R2= 1.5 Mega Ohm Cutoff frequency = 1 / (2pi x sqrt(R1xR2xC1xC2)) = 1 / (2pi x R1 xC1) = 1 / (2pi x (1.5 Mega Ohm) x (0.1 uF)) = 1.06 Hz The high pass filter cutoff frequency is 1.06 Hz . http://ourworld.compuserve.com/homepages/Bill_Bowden/opamp.htm
Second Order High Pass filter The high pass filter cutoff frequency is 1.06 Hz .
Second Order Low Pass filter C1= 0.1 uF C2= 0.1 uF R1= 56 KOhm R2= 56 KOhm Cutoff frequency =1 / (2pi x sqrt(R1xR2xC1xC2)) = 1 / (2pi x R1 xC1) = 1 / (2pi x (56 KOhm) x (0.1 uF)) = 28.4 Hz The low pass filter cutoff frequency is 28.4 Hz . http://ourworld.compuserve.com/homepages/Bill_Bowden/opamp.htm
Second Order Low Pass Filter The low pass filter cutoff frequency is 28.4 Hz .
Signal to Noise Ratio (SNR) • Signal-to-noise ratio (P is average power, A is RMS amplitude) http://en.wikipedia.org/wiki/Signal-to-noise_ratio
Signal to Noise Ratio (SNR) • Signal to noise testing -For Brooks Signal: 214.1 mV Noise: 35.63 mV SNR = 20 log (214.1 / 35.63) =17.5 dB -For Youn Signal: 387.5 mV Noise: 35 mV SNR = 20 log (387.5/ 35) =20.9 dB • We have different value of SNR for each person.
EKG Circuit – Final Design • 3 EKG electrodes • 2 placed on the right and left wrist • 1 placed on the neck to ground the user • 3 Conductor Shielded Cable • 4 Operational Amplifiers (LM741) • 1 instrumentation Amplifier (AD622)
EKG Circuit – Breadboard Design - 4 Operational Amplifiers (LM741) - 1 Instrumentation Amplifier (AD622)
Eagle for PCB • Schematic Design • Board Design • Library Design
PCB Problem • Large boards seem to be a problem for the mil. • In our PCB, the problem is that GND and -V(-9V)are connected each other. • So when I connect GND and -V(-9V) with power supply, this -V(-9V) changes to 0.
EKG Output Unfiltered EKG: Filtered EKG (filtering out 60 Hz noise): :
Moving towards interfacing Final Design Initial Design ATMEGA168 PIC16F877A FT232 USB-UART IC Arduino USB board PIC image: http://www.machinescience.com/catalog/images/Microcontroller.jpg ATMEGA168 image: http://strawberry-linux.com/thumb/ atmega168.jpg
A/D conversion • Performed on ATMEGA168 microcontroller • 10-bit resolution • Sample and Hold method • Sampling rate 77 kHz Source: ATmega48/88/168 Complete Datasheet, revision K, 4/07, Atmel Corporation, http://www.atmel.com/dyn/products/product_card.asp?part_id=3303
USB Data Transfer • FT232 chip • Arduino device driver • 9600 bps • Data transfer testing (Arduino live monitoring) References: Arduino documentation, www.arduino.cc FT232 datasheet, http://www.ftdichip.com/Products/FT232BM.htm
Reading data in Matlab • Open and read port in Matlab • Virtual COM USB device appears as COM (serial) port Possible due to FT232 driver • Difficulties (slow speed) Code is original but referred to documents at www.mathworks.com
Pulse Detection Triggering Successful triggering occurs at each arrow Threshold
Successful Trigger Statistics correspond to waveform seen on previous slide
Threshold Triggering challenges Non-ideal EKG waveform Example: triggering disrupted by enlarged T wave Solution Distinguish waves based on width
Motion artifact Baseline shift This is a relatively small shift due to motion Greater motion shifts signal outside of measurable range
Testing pulse detection accuracy Pulse detection 90% successful for seated, still user with “normal” EKG waveform
Data display and storage Display • User interface with clickable updating • Automatic quantitative storage • One-click waveform saving Storage • Qualitative data Waveform image saved as TIF • Heart rate / missed beat statistics Data saved as text
Summary of Testing Results • Safety testing Current to user limited to 0.45 µA • Signal to Noise Ratio 15 to 20 dB depending on internal impedance of user • Measured system accuracy ~90% accurate heart rate detection (one false positive, one false negative per 20 measurements)
Youn’s EKG The T wave represents the recovery of the ventricles. The interval from the beginning of the QRS complex to the apex of the T wave is referred to as the absolute refractory period. Tall or "tented" symmetrical T waves may indicate hyperkalemia. Hyperkalemia is an elevated blood level of the electrolyte potassium. http://en.wikipedia.org/wiki/Electrocardiogram
Conclusions • Familiarization with one’s EKG • Recommended improvements
Thank You Hyesun Park Professor Gary Swenson Dr. Ray Fish