Download
1 / 22
220 likes | 254 Views
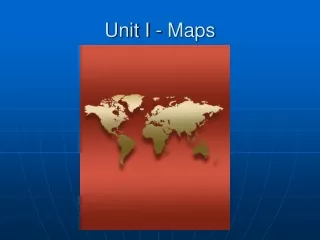
Explore the fundamentals of cartography, including scale, projection, and symbols used in maps. Understand the distortions in different map projections and learn about various types of thematic maps. Discover the concept of mental maps and the use of coordinate systems in geography.

E N D
Cartography • Cartography – science of map-making • What makes up parts of a map? • Scale, Projection and Symbol
Map Basics • Scale- the relationship between the length of an object on a map to its length on the landscape • Small Scale shows a large area – 1:250,000 (World Map) • Large Scale shows a small area in detail – 1:1000 (City Map) Small Scale Large Scale World Map Continent Country Region State City Neighborhood
Symbols on a Map Represent cities, capitals, roads, etc… Point symbols, show individual features or places
Maps • Maps=flat, while Earth is 3-D • 3D shapes can never truly be 2D • All maps show distortion • The level and area of distortion depends on the type of map used
Mercator Projection Mercator Projection Map = Distortion as you get farther away from the equator!
Why use Mercator? Used for navigation along equatorial regions (no distortion at the equator) Many wall maps are still using this projection
Robinson Projection • Provides better balance of size and shape at higher latitudes • (does not maintain accurate area, shape, distance, or direction…but minimizes errors)
Conic • Great distortion away from central area
Planar Projection Useful for less distortion at the POLES!
Map Categories • The most basic type of maps that serves a general purpose are called reference maps • Other types of thematic maps are: choropleth, isoline, proportional symbol, and dot
Choropleth • Puts data into a spatial format and is useful for determining demographic data (mortality rates) • Can be very misleading as the variables can be changed to manipulate the message shown
Isoline • An isoline map is a map with continuous lines joining points of the same value • Usually used to show elevation and weather variables • Isolines close together show a rapid change in the variable
Proportional Symbol • The size of the symbol will vary from place to place according in proportion to the quantities the symbol represents
Dot Maps-A dot map uses a dot to represent the number of a variable found within an areaDot maps: use points to show the precise locations of specific observations or occurrences (crime, births or disease).
cartograms – chart and assign data by size.Examples: populations, mortality rates, GDP Gross Domestic Product
A Little More Stuff • Remote Sensing- Acquisition of data about the earth’s surface using satellites and other long range methods • Global Information System (GIS)-Computer system that stores, organizes, and displays geographic data • Global Positioning System (GPS)- Using a series of satellites to determine location on the earths surface
Mental Maps • An individual’s internal, geographic understanding of a place. • Formed when people perceive information about their surroundings and then process that information into a mental image that reflects both the physical environment and that individual’s social, cultural, and psychological framework. • May include hazards – items/places a person avoids during their daily routine.
Coordinate system Absolute location Longitude and latitude Meridians – Prime Meridian International Date Line Parallels Site Situation – Relative location Absolute distance Relative distance Connectivity Time-Space Convergence Location/DistanceGeographers use these to establish location and distance: