Download

1 / 1
10 likes | 275 Views
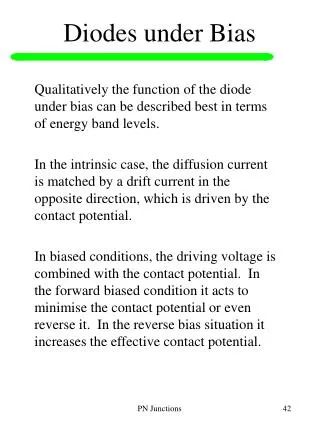
PHOTODIODE For generic p-n diode: Diffusion current = Drift Current Reverse biasing a diode reduces diffusion current, resulting in a net reverse current For photodiode: Window allows photons into material, a percentage of photons create electron-hole pairs (EHPs)

E N D
PHOTODIODE • For generic p-n diode: Diffusion current = Drift Current • Reverse biasing a diode reduces diffusion current, resulting in a net reverse current • For photodiode: Window allows photons into material, a percentage of photons create electron-hole pairs (EHPs) • Negligible increase in Diffusion current, dramatic increase in drift current • Effectiveness of photodiode - Responsitivity: the ratio of reverse current to power of incident light. Expressed in amps/watt • The FDS1010 has a speculated responsitivity of .5 A/W for 780 nm wavelength light. Abstract The purpose of this project is to create a remote sensor array that will detect the presence of toxins in large bodies of water released during harmful algal blooms. The proposed solution will consist of a sensor that will: i) provide pulses of light through an optical antenna array; ii) diminish the intensity of light as the toxin concentration increases; iii) provide a signal that corresponds to the presence of toxins. My role in the project is to develop a prototype circuit that will be used as a proof of concept. Testing has been done to ensure the selected components are working as expected. Introduction A hazardous algal bloom occurs when a sudden increase of nutrients in large bodies of water leads to a rapid growth of first-order organisms that can cause harm to their environment, e.g. the release of the toxin microcystin. Our plan is to create a remote sensing node that will monitor for the presence of specific toxins and wirelessly transmit any detection to a central location. This will be done by providing a pulse of light directed through a film that reduces its intensity when the target toxins are present. The reduction of light will be measured by a photosensor to provide a signal that will correlate to the concentration of toxin.. c) a) Detection of Harmful Algal BloomsMatthew Barboza, Supervising Professor Dr. Sungyong JungSummer REU National Science Foundation AMIC a) a) Array of sensor nodes transmitting data to central location b) Proposed integrated circuit for microcystin detection ADC PERFORMANCE The microcontroller is programed to convert a voltage signal in the range of 0 to 3.2 V into a 10-bit number. The signal was created from a potentiometer, which has its bulk resistance located between the voltage supply and ground. The upper four bits of the result are used to drive four output pins of the controller connected to leds. This allows me to see what the ADC is measuring in .2 volt increments. By sweeping the wiper across its full range and measuring at what input voltages the output leds change their value, I can get an accurate representation of how close the ADC result is to the applied voltage.. a) ADC test set-up b) ADC test schematic c) ADC test results Summary and Conclusion The result from the ADC gave an accurate representation of the input voltage. Any discrepancy can be attributed to the potentiometer. The photodiode showed both a noticeable increase in current with an increase in light and a stable output regardless of a varying bias voltage. Further testing will include a reliable control of light with the laser diode and the use of the transimpedance amplifier to allow the microcontroller’s ADC to indirectly measure the response from the photodiode. b) b) • Materials • A dsPIC33FJ128MC802 microcontroller from Microchip. • The microcontroller will be programed using C code and the manufacturer provided development environment, MPLAB X, and a separately purchased ICD 3 • D7805I laser diode: 5 mW optical power output with 780 nm wavelength • OPA380 transimpedance amplifier from DigiKey • FDS1010 photodiode from Thor Labs • Agilent E3620A Dual Power Supply, Agilent 34401A Digital Multimeter, DSO-X 2004A Oscilloscope b) PHOTODIODE RESPONSE The photodiode was placed in series with a measured resistance and a voltage source. As the voltage source increased, the diode’s reverse bias voltage was measured and the reverse current was calculated from the voltage across the resistor. Several data points were collected to obtain a current-voltage relationship. The process was repeated under a fluorescent lamp to see the effect of increased lighting. a) Photodiode test set-up b) Photodiode test schematic c) Photodiode test results Acknowledgements Thank you to Dr. Sungyong Jung and MohammadrezaMoghadam for their patience, guidance, and support, and to the National Science Foundation for their financial contribution: grant #EEC-1156801. a) c) Materials Circuit close-up