Download
1 / 51
510 likes | 848 Views
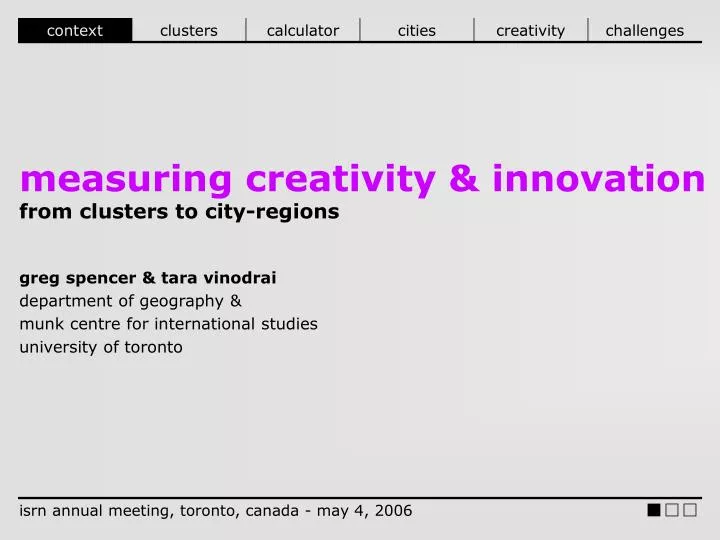
context. measuring creativity & innovation from clusters to city-regions. greg spencer & tara vinodrai department of geography & munk centre for international studies university of toronto. isrn annual meeting, toronto, canada - may 4, 2006. context. background.

E N D
context measuring creativity & innovationfrom clusters to city-regions greg spencer & tara vinodrai department of geography & munk centre for international studies university of toronto isrn annual meeting, toronto, canada - may 4, 2006
context background • goals of cluster research (MCRI I) • benchmark ISRN case studies to allow for comparison • better our understanding of what makes for ‘successful’ clusters • consider what (if any) impact clusters have on regional economic performance • goals of city-region research (MCRI II) • profiles of the 15 city-regions to facilitate comparison and the selection of case study sectors / occupational groups, etc. • understand the relationship between economic performance, diversity and the strength of local and non-local linkages and knowledge flows • explore the relationship between economic performance and quality of place from clusters to city-regions – spencer & vinodrai
context outline • provide background and key findings from cluster research (MCRI I) • quantitative methodology for identifying clusters • analysis of cluster performance • introduce and describe the cluster calculator database • industry level database • transition to city-region research (MCRI II) • background information on ISRN case studies • database re-design, development and tools • provide some examples of how we might measure and analyze the relationships between creativity, innovation and economic performance in city-regions • identify challenges and next steps from clusters to city-regions – spencer & vinodrai
clusters key questions addressed • how do we systematically define clusters in the Canadian context? • functional boundaries? • geographic boundaries? • necessary for direct inter-cluster comparison/analysis • does clustering make a difference? • impact on industries/firms • impact on city-regions from clusters to city-regions – spencer & vinodrai
clusters defining clusters: level of analysis • clusters determined inductively using consistent definitions and systematic rules • industry (300 industries) • 1997 North American Industrial Classification System (NAICS) • measured at the 4-digit level • geography (140 cities) • 27 Census Metropolitan Areas (CMAs, urban core ≥100,000) • 113 Census Agglomerations (CAs, urban core ≥10,000) • three step methodology: • geographic concentration of industries • systematic co-location of industries • scale (1000+ employees), concentration (LQ≥1), scope (at least 50% of individual industries with LQ≥1) from clusters to city-regions – spencer & vinodrai
clusters defining clusters: an overview 4-digit NAICS (300 industries) basic geographically concentrated (218 industries) non-basic geographically ubiquitous (82 industries) step 1: identify industries that tend to concentrate in certain places clustering geographic co-location (167 industries) non-clustering no geographic co-location (51 industries) step 2: identify industries that frequently locate in the same places (19 different groups) clustered scale, scope & concentration (263 cases) non-clustered lack of scale, scope or concentration (2,397 cases) step 3: criteria for identifying clusters in particular cities from clusters to city-regions – spencer & vinodrai
clusters defining clusters: canadian cluster universe Agriculture Plastics & Rubber Textiles & Apparel Steel & Steel Products Maritime ICT Manufacturing Automotive Forestry & Wood Products ICT Services Higher Education Biomedical Mining Business Services Finance Food & Beverage Creative & Cultural Oil & Gas Construction Logistics from clusters to city-regions – spencer & vinodrai
11 clusters • 5 clusters • 1 cluster clusters cluster count by city-region from clusters to city-regions – spencer & vinodrai
clusters cluster count by province from clusters to city-regions – spencer & vinodrai
clusters average income: clusters outperform non-clusters from clusters to city-regions – spencer & vinodrai
clusters average income by industry: clustering vs. non-clustering from clusters to city-regions – spencer & vinodrai
clusters growth: clusters outpace non-clusters from clusters to city-regions – spencer & vinodrai
clusters growth by industry: clustering vs. non-clustering from clusters to city-regions – spencer & vinodrai
clusters average regional income by employment in clusters from clusters to city-regions – spencer & vinodrai
clusters population growth by employment in clusters from clusters to city-regions – spencer & vinodrai
calculator cluster database: data sources • sources of data • Census of Population, 2001 • social, demographic and economic data for the labour force • Canadian Business Patterns, 1998-2005 • establishments by size category • US Patent and Trademark Office (USPTO), 2000-2003 • number of patents from clusters to city-regions – spencer & vinodrai
calculator cluster database: structure and variables • 154 geographies • 113 census agglomerations (CAs) • 27 census metropolitan areas (CMAs) • 13 provinces/territories + national total • 420 industries • 300 4-digit NAICS level • 99 3-digit NAICS level • 20 2-digit NAICS level + total labour force • 151 variables (for each industry/geography combination) • occupation (60) • educational attainment (12); major field of study (13) • mobility status (9); immigrant status (4); age (10) • labour force activity (5); class of worker (8); hours worked (6) • income (5); establishments (18); patents (1) from clusters to city-regions – spencer & vinodrai
calculator cluster database: size • 9,766,680 data points / cells • 420 industries x 154 geographies x 151 variables • BUT flexibility to define groups of industries, therefore there are a large number of possible combinations of industries • Σ(300Ck) = Σ (300!/[k! * (300-k)!]), where k=1 to 300 • SO … the database can generate ~ 47,638 x 1090 different measurements on the fly • ~2,037,000,000,000,000,000,000,000,000,000,000,000,000, 000,000,000,000,000,000,000,000,000,000,000,000,000, 000,000,000,000,000 combinations of 4-digit level industries x 154 geographies x 151 variables from clusters to city-regions – spencer & vinodrai
calculator cluster database: indicators (60+) • critical mass / specialization • employment, establishments - absolute & relative size • cluster scope (breadth) • knowledge intensity • occupation-based (e.g., professional, technical, trades, science & technology occupations) • education-based (e.g., highest level of schooling, field of specialization) • performance and dynamism • establishment growth, 1998-2005 • average employment income • patents, 2000-2003 (cumulative); patents per 1,000 labour force • in-migration (domestic, foreign) from clusters to city-regions – spencer & vinodrai
calculator from clusters to city-regions: database re-design from clusters to city-regions – spencer & vinodrai
cities key questions to address • social dynamics of innovation • what is the relationship between economic performance, economic diversity and the relative strength of internal / external linkages? • explore possibilities of measuring network structure and diversity • social foundations of talent attraction/retention • what are the relationships between creativity, economic performance and quality of place? • cultural dynamism, social diversity, openness and tolerance, social inclusion and cohesion, socio-spatial polarization • do these relationships hold across the urban hierarchy? • socio-economic and demographic profiles of city-regions • what are the socio-economic and demographic characteristics of the 15 city-regions included in the ISRN study? from clusters to city-regions – spencer & vinodrai
cities ISRN case study city-regions from clusters to city-regions – spencer & vinodrai
cities city-regions by population size (>100K) from clusters to city-regions – spencer & vinodrai
cities population distribution of city-regions from clusters to city-regions – spencer & vinodrai
cities city-region profiles and database • city-region profiler tool • possible to create socio-economic and demographic profiles for all 27 CMAs and 113 CAs • demographics, migration and population change • education, employment, occupational structure • industrial structure, clusters, establishments, income • city-region schematic mapping tool • represent socio-economic and demographic indicators (geo)graphically for all 27 CMAs and 113 CAs • city-region comparative database and tools • currently under development • emphasis on place-based characteristics and change over time • data at the city-region level including measures of social and economic diversity, social inclusion/cohesion, quality of place from clusters to city-regions – spencer & vinodrai
creativity creativity, innovation & cities: some preliminary questions • how can we measure creativity and innovation? • what is the relationship between diversity, creativity and innovation? • are creative / talented workers more mobile than other workers? how can these patterns be understood within the context of broader migration in Canada? from clusters to city-regions
creativity how can we measure creativity & innovation? • industry / cluster characteristics • creative / cultural industries (e.g. fashion, film and television, furniture, design, music, new media, publishing, etc.) • levels of patenting • absolute and relative measures at the city-region level and by industry / cluster • occupations • artists, designers, ‘bohemians’ • science & technology workers • knowledge workers, ‘creative class’ from clusters to city-regions
creativity measuring creativity & innovation: patents from clusters to city-regions
creativity measuring creativity & innovation: creative clusters Elect. & precision equipment repair & maintenance Mfg & reproducing magnetic & optical media Motion picture & video industries Radio & television broadcasting Software publishers Other schools & instruction Technical & trade schools Specialized design services Independent artists, writers & performers Performing arts companies Sound recording industries Grant-making & giving services Advertising & related services Promoters of performing arts & similar events Agents … for artists, entertainers… Spectator sports from clusters to city-regions
creativity measuring creativity: earnings in cultural industries from clusters to city-regions
creativity measuring creativity & innovation: ‘creative class’ from clusters to city-regions
creativity geography of the ‘creative class’: golden horseshoe from clusters to city-regions
creativity geography of the ‘creative class’: vancouver from clusters to city-regions
creativity geography of the ‘creative class’: montreal from clusters to city-regions
creativity geography of the ‘creative class’: atlantic region from clusters to city-regions
creativity geography of the ‘creative class’: prairies from clusters to city-regions
creativity diversity, creativity and innovation • hypothesis: places with high levels of diversity, openness and tolerance, etc. will be more able to attract highly skilled, talent workers and have higher levels of economic performance • how can we operationalize this? • unanswered questions: • to what extent do these relationships hold in the Canadian case? • do these relationships hold across the urban hierarchy? • what possibilities exist for talent attraction/retention strategies while maintaining goals of social inclusion/cohesion? from clusters to city-regions
creativity creativity & diversity in canadian city-regions n=27 from clusters to city-regions
creativity creativity & tolerance in canadian city-regions n=27 from clusters to city-regions
creativity gender, immigrant/visible minority status & ‘creative class’ from clusters to city-regions
creativity talent attraction/retention: mobility of creative workers • hypothesis: creative / talented workers are attracted to places with high levels of diversity, openness and tolerance, etc. • unanswered questions: • little evidence that documents actual flows of talent between places • are creative / talented workers more mobile than other workers? • what are their patterns of mobility? • complex picture of migration flows • distinctive and highly uneven geography of migration • differences between domestic and international flows of talent • characteristics of domestic and international migrants (e.g. age, qualifications, occupation, etc.) from clusters to city-regions
creativity flows of talent: creative workers are more mobile from clusters to city-regions
creativity flows of talent: % migration by occupation – top 15 from clusters to city-regions
creativity flows of talent: % migration by occupation – bottom 15 from clusters to city-regions
creativity flows of people: net domestic and international migration from clusters to city-regions
creativity flows of people: net domestic migration from clusters to city-regions
creativity quality of place for whom? migration by age group from clusters to city-regions
creativity quality of place for whom? domesticmigration by city size from clusters to city-regions
challenges next steps: data sources and metrics • incorporation of additional data to support research around the themes of the ISRN • develop metrics based on data currently available • measures of economic and social diversity, social inclusion, quality of place, patents • [insert your suggestion here] • develop metrics based on new data sources • measures of cultural assets, R&D data, firm dynamics, flows of people and goods • [insert your suggestion here] • investigate new data sources • Longitudinal Employment Analysis Program (LEAP) • Community Innovation Indicators • Airport Activity Statistics, Coastwise Shipping Survey, Marine International Freight Origin and Destination Survey, 1996-2004 • [insert your suggestion here] from clusters to city-regions – spencer & vinodrai
challenges next steps: analysis • hypothesis testing and multivariate analysis • what is the relationship between economic performance, economic diversity and the relative strength of local and non-local linkages and knowledge flows? • diversity vs. specialization • variations by size, proximity to major centres • what is the relationship between economic performance and quality of place? • attraction / retention of talented workers • social inclusion and socio-spatial polarization • change over time • variations by size, proximity to major centres • explore possibilities for international comparisons (US, Europe) from clusters to city-regions – spencer & vinodrai