Download
1 / 1
10 likes | 91 Views
Climate of Debrecen from the point of view of Thornthwaite*. G. Szász 1 , F. Ács 2 , H. Breuer 2 and Sz. Szalai 2 *Presented at the 5 th ALPS-ADRIA Scientific Workshop 6-11 March 2006, Opatija, Croatia 1 University of Debrecen, Böszörményi út 138, H-4032 Debrecen, Hungary

E N D
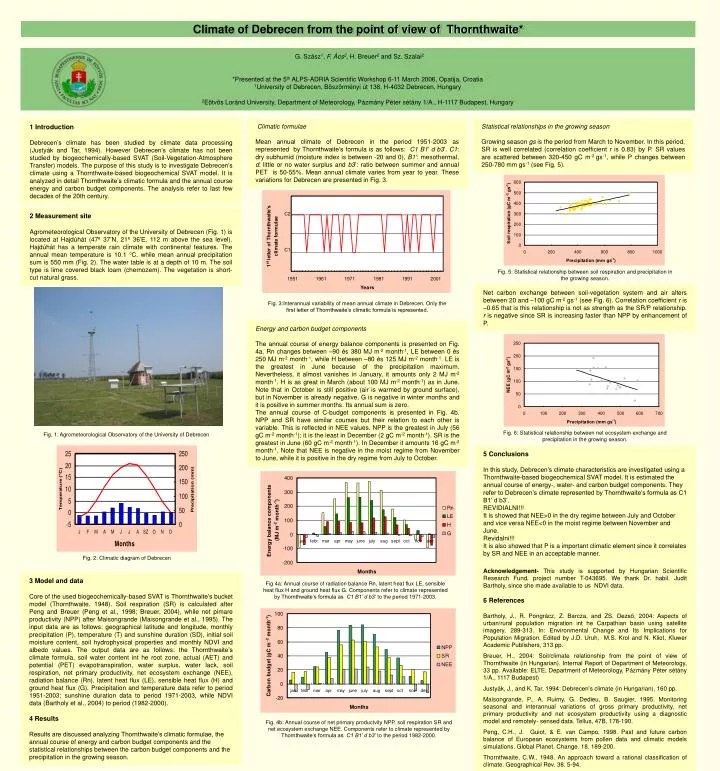
Climate of Debrecen from the point of view of Thornthwaite* G. Szász1, F. Ács2, H. Breuer2 and Sz. Szalai2 *Presented at the 5th ALPS-ADRIA Scientific Workshop 6-11 March 2006, Opatija, Croatia 1University of Debrecen, Böszörményi út 138, H-4032 Debrecen, Hungary 2Eötvös Loránd University, Department of Meteorology, Pázmány Péter sétány 1/A., H-1117 Budapest, Hungary 1 Introduction Debrecen’s climate has been studied by climate data processing (Justyák and Tar, 1994). However Debrecen’s climate has not been studied by biogeochemically-based SVAT (Soil-Vegetation-Atmosphere Transfer) models. The purpose of this study is to investigate Debrecen’s climate using a Thornthwaite-based biogeochemical SVAT model. It is analyzed in detail Thornthwaite’s climatic formula and the annual course energy and carbon budget components. The analysis refer to last few decades of the 20th century. Climatic formulae Mean annual climate of Debrecen in the period 1951-2003 as represented by Thornthwaite’s formula is as follows: C1B1’ db3’. C1: dry subhumid (moisture index is between -20 and 0), B1’: mesothermal, d: little or no water surplus and b3’: ratio between summer and annual PET is 50-55%. Mean annual climate varies from year to year. These variations for Debrecen are presented in Fig. 3. Statistical relationships in the growing season Growing season gs is the period from March to November. In this period, SR is well correlated (correlation coefficient r is 0.83) by P. SR values are scattered between 320-450 gC m-2 gs-1, while P changes between 250-780 mm gs-1 (see Fig. 5). 2 Measurement site Agrometeorological Observatory of the University of Debrecen (Fig. 1) is located at Hajdúhát (47º 37’N, 21º 36’E, 112 m above the sea level). Hajdúhát has a temperate rain climate with continental features. The annual mean temperature is 10.1 C, while mean annual precipitation sum is 550 mm (Fig. 2). The water table is at a depth of 10 m. The soil type is lime covered black loam (chernozem). The vegetation is short-cut natural grass. C2 C1 Fig. 5: Statistical relationship between soil respiration and precipitation in the growing season. Net carbon exchange between soil-vegetation system and air alters between 20 and –100 gC m-2 gs-1 (see Fig. 6). Correlation coefficient r is –0.65 that is this relationship is not as strength as the SR/P relationship. r is negative since SR is increasing faster than NPP by enhancement of P. Fig. 3:Interannual variability of mean annual climate in Debrecen. Only the first letter of Thornthwaite’s climatic formula is represented. Energy and carbon budget components The annual course of energy balance components is presented on Fig. 4a. Rn changes between –90 és 380 MJ m-2 month-1, LE between 0 és 250 MJ m-2 month-1, while H between –80 és 125 MJ m-2 month-1. LE is the greatest in June because of the precipitation maximum. Nevertheless, it almost vanishes in January, it amounts only 2 MJ m-2 month-1. H is as great in March (about 100 MJ m-2 month-1) as in June. Note that in October is still positive (air is warmed by ground surface), but in November is already negative. G is negative in winter months and it is positive in summer months. Its annual sum is zero. The annual course of C-budget components is presented in Fig. 4b. NPP and SR have similar courses but their relation to each other is variable. This is reflected in NEE values. NPP is the greatest in July (56 gC m-2 month-1); it is the least in December (2 gC m-2 month-1). SR is the greatest in June (60 gC m-2 month-1). In December it amounts 16 gC m-2 month-1. Note that NEE is negative in the moist regime from November to June, while it is positive in the dry regime from July to October. Fig. 6: Statistical relationship between net ecosystem exchange and precipitation in the growing season. Fig. 1: Agrometeorological Observatory of the University of Debrecen 5 Conclusions In this study, Debrecen’s climate characteristics are investigated using a Thornthwaite-based biogeochemical SVAT model. It is estimated the annual course of energy-, water- and carbon budget components. They refer to Debrecen’s climate represented by Thornthwaite’s formula as C1 B1’ d b3’. REVIDIALNI!!! It is showed that NEE>0 in the dry regime between July and October and vice versa NEE<0 in the moist regime between November and June. Revidalni!!! It is also showed that P is a important climatic element since it correlates by SR and NEE in an acceptable manner. Fig. 2: Climatic diagram of Debrecen Acknowledgement- This study is supported by Hungarian Scientific Research Fund, project number T-043695. We thank Dr. habil. Judit Bartholy, since she made available to us NDVI data. 6References Bartholy, J., R. Pongrácz, Z. Barcza, and ZS. Dezső, 2004: Aspects of urban/rural population migration int he Carpathian basin using satellite imagery, 289-313. In: Environmental Change and Its Implications for Population Migration. Edited by J.D. Uruh, M.S. Krol and N. Kliot, Kluwer Academic Publishers, 313 pp. Breuer, H., 2004: Soil/climate relationship from the point of view of Thornthwaite (in Hungarian). Internal Report of Department of Meteorology, 33 pp. Available: ELTE, Department of Meteorology, Pázmány Péter sétány 1/A., 1117 Budapest) Justyák, J., and K. Tar, 1994: Debrecen’s climate (in Hungarian), 160 pp. Maisongrande, P., A. Ruimy, G. Dedieu, B. Saugier, 1995. Monitoring seasonal and interannual variations of gross primary productivity, net primary productivity and net ecosystem productivity using a diagnostic model and remotely- sensed data. Tellus, 47B, 178-190. Peng, C.H., J. Guiot, & E. van Campo, 1998. Past and future carbon balance of European ecosystems from pollen data and climatic models simulations. Global Planet. Change. 18. 189-200. Thornthwaite, C.W., 1948. An approach toward a rational classification of climate. Geographical Rev. 38. 5-94. 3 Model and data Core of the used biogeochemically-based SVAT is Thornthwaite’s bucket model (Thornthwaite, 1948). Soil respiration (SR) is calculated after Peng and Breuer (Peng et al., 1998; Breuer, 2004), while net pimare productivity (NPP) after Maisongrande (Maisongrande et al., 1995). The input data are as follows: geographical latitude and longitude, monthly precipitation (P), temperature (T) and sunshine duration (SD), initial soil moisture content, soil hydrophysical properties and monthly NDVI and albedo values. The output data are as follows: the Thornthwaite’s climate formula, soil water content int he root zone, actual (AET) and potential (PET) evapotranspiration, water surplus, water lack, soil respiration, net primary productivity, net ecosystem exchange (NEE), radiation balance (Rn), latent heat flux (LE), sensible heat flux (H) and ground heat flux (G). Precipitation and temperature data refer to period 1951-2003; sunshine duration data to period 1971-2003, while NDVI data (Bartholy et al., 2004) to period (1982-2000). 4 Results Results are discussed analyzing Thornthwaite’s climatic formulae, the annual course of energy and carbon budget components and the statistical relationships between the carbon budget components and the precipitation in the growing season. Fig 4a: Annual course of radiation balance Rn, latent heat flux LE, sensible heat flux H and ground heat flux G. Components refer to climate represented by Thornthwaite’s formula as C1 B1’ d b3’ to the period 1971-2003. Fig. 4b: Annual course of net primary productvity NPP, soil respiration SR and net ecosystem exchange NEE. Components refer to climate represented by Thornthwaite’s formula as C1 B1’ d b3’ to the period 1982-2000.