Download
1 / 15
150 likes | 217 Views
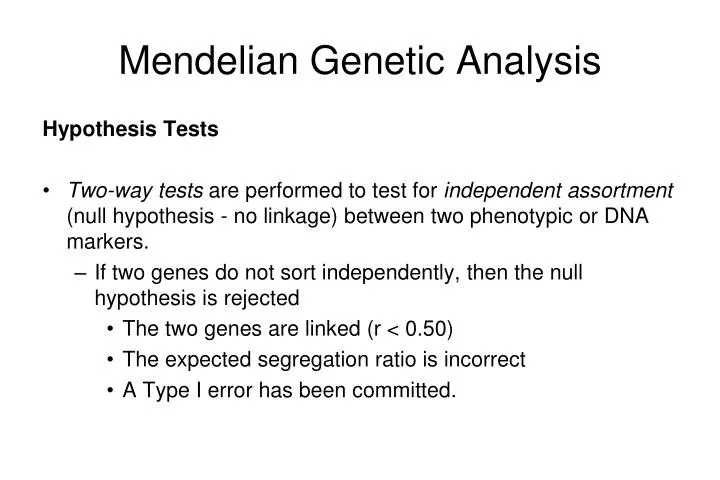
Mendelian Genetic Analysis. Hypothesis Tests Two-way tests are performed to test for independent assortment (null hypothesis - no linkage) between two phenotypic or DNA markers. If two genes do not sort independently, then the null hypothesis is rejected

E N D
Mendelian Genetic Analysis Hypothesis Tests • Two-way tests are performed to test for independent assortment (null hypothesis - no linkage) between two phenotypic or DNA markers. • If two genes do not sort independently, then the null hypothesis is rejected • The two genes are linked (r < 0.50) • The expected segregation ratio is incorrect • A Type I error has been committed.
Two-way or two-locus tests Relationship between G statistics
Two-way or two-locus tests Null hypothesis 1Aa : 1aa : 1Bb : 1bb ratio Two loci (mdh-5 and got-3) segregating in backcross progeny in maize i = ith genotype at the mdh-5 locus j = jth genotype at the got-3 locus m = No. of genotypic classes for locus mdh-5 n = No. of genotypic classes for locus got-3 Total G-statistics for Locus A and B Pr[GT > 2(m-1)(n-1)] = Pr[62.466 > 21] = 2.32 x 10⁻¹⁵ Null hypothesis (no linkage) is rejected
Two-way or two-locus tests Null hypothesis 1Aa : 1aa ratio or 1Bb : 1bb ratio Two loci (mdh-5 and got-3) segregating in backcross progeny in maize i = ith genotype at the mdh-5 locus j = jth genotype at the got-3 locus m = No. of genotypic classes for locus mdh-5 n = No. of genotypic classes for locus got-3 Individual G-statistics for Locus A and B Pr[GLA > 2m-1] = Pr[0.28 > 21] = 0.599 Pr[GLB > 2n-1] = Pr[0.031 > 21] = 0.860 Null hypothesis is NOT rejected for both samples
Two-way or two-locus tests Relationship between G statistics Pr[GL > 2(m-1)(n-1)] = Pr[62.46 > 21] = 2.8 x 10⁻¹⁵ Null hypothesis (no linkage) is rejected for both samples
Two-way or two-locus tests Two loci (mdh-5 and got-3) segregating in backcross progeny in maize Null hypothesis mdh-5 and got-3 are segregating independently i = ith genotype at the mdh-5 locus j = jth genotype at the got-3 locus m = No. of genotypic classes for locus mdh-5 n = No. of genotypic classes for locus got-3 The linkage G-statistic is Pr[GL > 2(m-1)(n-1)] = Pr[62.46 > 21] = 2.8 x 10⁻¹⁵
Maximum likelihood estimate (MLE) of recombination (1) r = recombination frequency fi = expected frequency of ith genotype = observed number of the ith genotype = total number of observations (2) (4) (3) For backcross progeny segregating for dominant or codominant markers linked in coupling: (5) (6) (7) f1 = f4 = 0.5(1 - r) f2 = f3= 0.5r MLE of r for other population structures are less straightforward
Maximum likelihood estimate (MLE) of recombination A B AB/ab NR MLE a b number of recombinants A b Ab/ab R a b a B Total number of individuals aB/ab R a b a b ab/ab NR a b MLE of r for other population structures are less straightforward
MLE of r Two loci (mdh-5 and got-3) segregating in backcross progeny in maize AB/ab NR f1 = 53 Ab/ab R f2 = 9 aB/ab R f3 = 13 ab/ab NR f4 = 55 MLE
Sampling error of MLE of recombination • Information content of MLE • Variance of MLE influenced by n, the number of progeny sampled
Deducing the MLE of r using the likelihood profile method Two loci (mdh-5 and got-3) segregating in backcross progeny in maize AB/ab NR f1 = 53 Ab/ab R f2 = 9 aB/ab R f3 = 13 ab/ab NR f4 = 55 The likelihood of r given the observed data is:
Deducing the MLE of r using the likelihood profile method r = 0.169 MLE r = 0.169 maximum likelihood -25.669
Likelihood odds ratio statistic (LOD) • Base-10 log likelihood ratio test statistic Likelihood odds ratio statistic Hypotheses H0: r = 0.50 H1: 0.0 ≤ r < 0.5 LOD score is the observed frequency of recombination Probability of Type I error = 10-Z LOD of 3 ~ = 0.001
Likelihood odds ratio statistic (LOD) Two loci (mdh-5 and got-3) segregating in backcross progeny in maize AB/ab NR f1 = 53 Ab/ab R f2 = 9 aB/ab R f3 = 13 ab/ab NR f4 = 55 The likelihood of r (q ) given the observed data is: LOD score Prob. of Type I error = 10-13.464 = 3.43 x 10⁻¹⁴ The null hypothesis is rejected
Support interval for the estimate of r MLE r = 0.169 Zmax = 13.464 rL= 0.106 rR = 0.247 1 LOD interval Relationship between LOD score (Z) and a c2 statistic is 4.6 X Z ~ c21 for Z = 1 then Pr[4.6≥ c21] = a = 0.032 Pr[rL≤ r ≤ rR] ≤ a ; Pr[0.106 ≤ r ≤ 0.247] ~ 0.032