Download
1 / 26
260 likes | 369 Views
MAP Measures of Academic Progress Northwest Evaluation Association Portland, OR. Using data to inform instruction. What data about student learning do we already have? What are some of the ways we can use the information planning classroom instruction differentiation Finding gaps

E N D
MAP Measures of Academic Progress Northwest Evaluation Association Portland, OR
Using data to inform instruction • What data about student learning do we already have? • What are some of the ways we can use the information planning classroom instruction • differentiation • Finding gaps • Monitoring progress • Monitoring remedial programs • Engaging concerned parents
Teacher Assigned Grades Grade knowledge and skill acquisition relative to other students in the class. Highly subjective (easy and hard graders, tests) Influenced by school culture and philosophy Do not indicate instructional level Do not always identify the skills and concepts individual students have learned or need to learn
Teacher Assigned Grades Grade Level Mean Scores Grade Level
National Averages Brevet Exams 2001- 2011 Civics
National Averages Brevet Exams 2001- 2011 Physics
TYPES OF TESTS • Critereon-referenced determining whether a student has mastered a specific skill or concept. • Normed-referenced : Compares performance on the normal curve.
Arabic Brevet 2011
Physics Brevet 2011
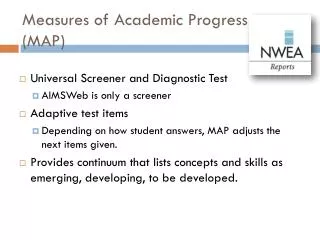
MAP Computer-adaptive Measures progress on a scale that identifies the student’s instructional level. Crosses grade levels.
Primary Grades: • Reading and mathematics A complete set of assessments each aligned to national and state curricula and standards • Reading, • language, • mathematics • Science: Concepts, processes and general science
Dynamically adapts • Answer a question correctly and the test presents a more challenging item • Miss a question, and MAP offers a simpler item Untimed Narrows in on a student’s learning level, engaging them with content that allows them to succeed. Immediate results Four times a year
RIT Scale (for Rasch Unit) Assigns a value of difficulty to each item Equal interval measurement Measures understanding regardless of grade level Tracks progress from year to year
Median readiness for: 230 Introduction to Algebra 235 Algebra 245 Geometry 200 represents typical of students in the Fall of grade 5
The 2011 NWEA RIT Scale Status and Growth Norms Representative of the U.S. school-age population. • Indicates typical RIT scores for students in grades K-11 5.1 million Students 13,000+ Schools 2,700+ Districts 50 states.
MAP tests provide highly accurate results that can be used to: • Identify the skills and concepts individual students have learned. • Diagnose instructional needs. • Monitor academic growth over time. • Make data-driven decisions at the classroom, school, and district levels. • Place new students into appropriate instructional and remedial programs.
Teacher Reports
Teacher Reports
DesCartes: • a Continuum of Learning • enhances a teacher’s ability to provide targeted instruction for individual students or groups of students • Lists Skills and Concepts to Enhance , • Skills and Concepts to Develop • Skills and Concepts to Introduce
Subject: Language Usage : RIT Score Range: 191 – 200 Attend to Conventions Uses I and me correctly Identifies proper nouns in written compositions Recognizes examples of verbs used as adjectives Discover/Explore; Clarify/Extend; Understand Forms Identifies persuasive writing Describes characteristics of poetry Selects an appropriate salutation for a business letter Generate and Focus; Enhance and Improve Orders sentences sequentially to form clear paragraphs Identifies the method of organization used in a multi-paragraph composition (deductive) Plan; Select/Process; Organize/Record/Evaluate Distinguishes between main topic and supporting details Evaluates to determine what type of language is most appropriate for a given purpose
Subject: Mathematics : RIT Score Range: 211 - 220 Number Determines factors of whole numbers Uses rounding to estimate answers to real-world problems involving numbers 1000 or greater using multiplication and division (whole numbers only) Patterns and Relations Reads and interprets Venn diagrams Uses simple linear equations to represent problem situations Shape and Space Knows the approximate size of a millimeter Determines an appropriate scale for representing a distance on a map Classifies polygons by number of sides Statistics and Probability Interprets data in line graphs (e.g., change over time) Determines probability from a real-world situation - number of possible outcomes given
Subject: Reading RIT Score Range: 211 – 220 Clarify and Extend; Select and Process Infers author's viewpoint/attitude in literary text Evaluates statements to choose the one which best represents the main idea of a literary paragraph Respond to Texts Recognizes characteristics of advertisements Identifies similes in literary text Understand Forms and Techniques Classifies literary texts as science fiction Describes how characters are developed in literary texts Use Strategies and Cues Evaluates predictions based on content in informational text
Your schools K-12 enrollment Number of students to test normally start with grades 4-8 The MAP version $14 - $15.50 / Student $1,500 license fee $2,750 online workshop. . on-site training Possible