Download

1 / 20
230 likes | 519 Views
Gender & Family. “That institution in society that arranges for: (1) Regulation of Sexual Relations; (2) Household Composition; (3) Child-Rearing”. Sex vs. Gender . Sex (a biological fact) The biological characteristics that differentiate women and men (XX or XY Chromosome)

E N D
Gender & Family “That institution in society that arranges for: (1) Regulation of Sexual Relations; (2) Household Composition; (3) Child-Rearing”
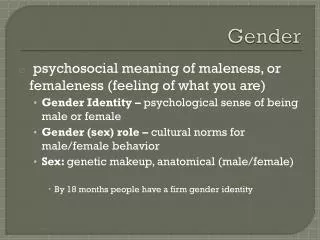
Sex vs. Gender • Sex (a biological fact) • The biological characteristics that differentiate women and men (XX or XY Chromosome) • Gender (a cultural & social-psychological fact) • The socially constructed patterning of masculinity and femininity, and of relations between women and men
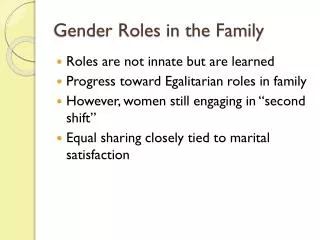
“Doing Gender”: Gender Socialization • Doing Gender: • (West and Zimmerman, 1987) the ongoing process through which people create gender for themselves and others by acting and appearing the way we “should” as men and women. • Gender as a social construction • Symbolic interaction
Socialization: The Importance of Peers and Others in Society Cultural & cognitive categorization into one group or the other Gender expectations for women and for men Sanctions for not behaving the way a man or woman is supposed to behave
Family • Regulation of Sexual Relations • Culture • Changes in Gender Roles • Divorce
Family & DivorceRegulation of Sexual Relations • Crude Divorce Rate = No. of divorces/100 (or 1000) married persons • 1920: 13.4 • !960: 23.1 • 1990: 51.1 • BUT: How the 50% rate is calculated • Annual marriage rate per 1,000/Annual divorce rate per 1,000 • 2003: • 7.5 marriages per 1,000 • 3.8 divorces per 1,000 (NCHS, 2005)
Family & DivorceRegulation of Sexual Relations • Better method of calculation • How many people who have ever married subsequently divorced? • Highest rate = ca. 41% • Factors Predicting Success & Failure • Education • Divorce rates lowest for college graduates • 1/3 to ¼ the rate of non-graduates • Age • Nearly ½ under age 18 • 40% under age 20 • 24% over age 25 • Religion • Born-again Christians same as general population (ca. 1/3)
Family & DivorceFactors Predicting Success & Failure • Region • Highest rates • South & Midwest • “Red” states higher than “blue” states • from Smart Marriages Listserv , Jan. 4, 2005 • Cohabitation • Couples cohabiting before marriage • Significantly higher risk of divorce than couples not cohabiting before marriage
Household Composition“Who Lives With Whom?” • Divorce (obvious effect) • Changing Household Forms • Living together has increased > six-fold • Often short term • Higher divorce rate • Staying single: • 2000: 27.2 million people, 26% of all households (in 1950, 9.3%) • Vs. 22% married couples & their kids • 21% married couples living alone
Household Composition“Who Lives With Whom?” • Changing Household Forms • Waiting Longer (Older married households)
Household Composition“Who Lives With Whom?” • Single Parent Households • 2000: ca. 13.5 million single parents had custody of 21.7 million children under 21 years of age • % of population made up by married couples with children decreased from 40% in 1970 to 24% in 2000 • Single parent households increased from 9% in 1990 to 16% of all households by 2000. • Of all custodial parents, 85% were mothers • Variation by race/ethnicity
Household Composition“Who Lives With Whom?” • Children in single-parent households by race/ ethnicity, 2006 (American Community Survey & Annie E. Casey Foundation, 2006)
Household Composition & Child-Rearing:Lineality & Locality • Unusual Society • Patterns of lineality & locality • Patrilineal • Trace blood & property lines along father’s side • Matrilineal • Trace blood & property lines along mother’s side
Household Composition & Child-Rearing:Lineality & Locality • Matrilocal • Children live with mother • Patrilocal • Children live with father • Locality & lineality have separated • Divorce • $ goes with dad • Kids go with mom
Family: Functional Changes & the State • Matrilocal & Patrilineal Society • Bureaucratization of the family • To meet child rearing function of family • due to household composition changes • Child-rearing • State has stepped in • Welfare • AFDC (until 1997) • TANF (since July 1, 1997)