Download
1 / 6
60 likes | 200 Views
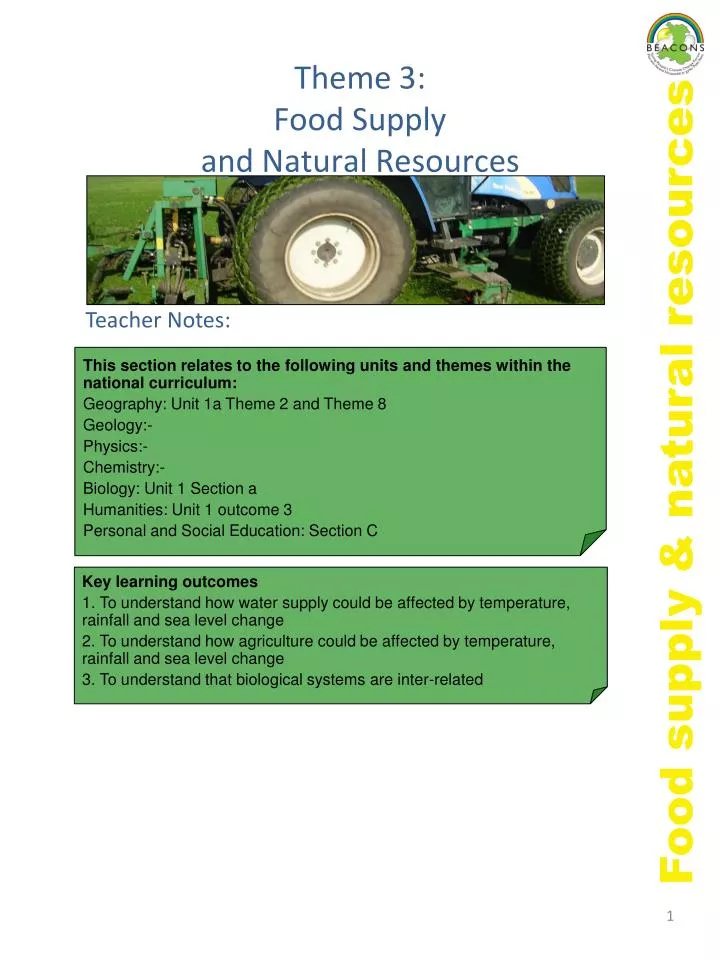
Theme 3: Food Supply and Natural Resources. Teacher Notes:. This section relates to the following units and themes within the national curriculum: Geography: Unit 1a Theme 2 and Theme 8 Geology:- Physics:- Chemistry:- Biology: Unit 1 Section a Humanities: Unit 1 outcome 3

E N D
Theme 3: Food Supply and Natural Resources Teacher Notes: This section relates to the following units and themes within the national curriculum: Geography: Unit 1a Theme 2 and Theme 8 Geology:- Physics:- Chemistry:- Biology: Unit 1 Section a Humanities: Unit 1 outcome 3 Personal and Social Education: Section C Food supply & natural resources Key learning outcomes 1. To understand how water supply could be affected by temperature, rainfall and sea level change 2. To understand how agriculture could be affected by temperature, rainfall and sea level change 3. To understand that biological systems are inter-related
Teachers Background Information About Food Supply and Natural Resources Introduction Food supply and natural resources are likely to be affected by changes in temperature, rainfall and sea level. Availability of water, farming productivity and biodiversity are particularly susceptible. Climate Risk Factor- Temperature Global: Temperature changes are most significant for regions such as Northern Canada and Northern Russia (increases up to 7.5oC by 2099). Consequences for biodiversity are particularly significant. Wales: Warmer summers (up to 4oC increase in summer by 2080) and milder winters may mean that ecosystems become unbalanced, some crops will no longer grow and livestock may require additional shelter from heat. Higher temperatures could also cause a reduction in water quality and encourage the growth of toxic algal blooms. Food supply & natural resources Climate Risk Factor- Rainfall Global: Areas such as North Africa and Southern Europe may experience reductions of up to 20% in summer rainfall. This could impact on availability of drinking water, food supplies and suitability of the environment to support ecosystems. Wales: Welsh summers may be drier (up to 40% by 2080) and winters wetter (up to 30% in West Wales by 2080). This could lead to more frequent summer droughts, with knock-on effects for natural resources. Increased winter rainfall (up to 30% by 2080) could lead to increased flooding and waterlogging. Coastal locations along South and West Wales are most likely to be affected, although some areas along the North East coast are also at risk. Climate Risk Factor- Sea Level Global: Average global sea level changes of up to 50cm by 2100 have been predicted. Low lying countries such as the Netherlands, atolls and small islands are particularly at risk of submergence. In addition, natural biological habitats may experience “coastal squeeze” as they become trapped by man-made features such as roads or sea-walls and a rising sea level. Wales: Welsh sea levels could increase by 50cm by 2095. Increases are expected to be slightly higher around South Wales and could lead to loss of agricultural land and contamination of freshwater lagoons by seawater.
Pupil Notes Water Supply Water availability across the world is likely to change as a result of decreased rainfall and increased temperatures. Many areas, such as Europe, Central and South America, parts of Africa and Australia could see a reduction of up to 20% in their water supply by 2060. Other areas, such as North West Canada, East Africa, India and East China are predicted to have an increase of up to 20% in water supply by 2060. This could occur during intense downpours, increasing possibilities of flooding. Figure 13. Change in Water Availability in 2060 ? Wales • Risk Factors • Reduced rainfall for human consumption • Increased temperatures lead to increase evaporation of freshwater. Source: http://www.ciwem.org/policy-and-international/international/global-water-security.aspx (high emissions) Food supply & natural resources What Does This Mean for Wales? Scientists suggest that Welsh summers could be drier and winters wetter. Reduction in summer rainfall could lead to drought. By 2080, there could be a 40% reduction in summer rainfall in some parts of West Wales. These areas are predominantly agricultural areas, therefore require consistent supplies of water. By 2080, increased winter rainfall of up to 30% could lead to increased run-off and waterlogging. Coastal locations along coastal South and West Wales are most likely to be affected, although some areas along the North East coast of Wales are also at risk. Figure 14. Reservoir owned by Dŵr Cymru Welsh Water, Elan Valley, Mid Wales. • Adaptation Options • Develop drought-tolerant crops • Desalinate- remove salt from seawater • Irrigate • Increase water storage capacity • Recycle water • Use water meters and pricing for domestic supply • Improve public understanding about the importance of conserving water. Source: Author
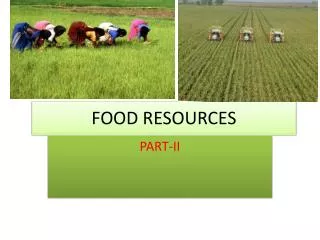
Farming Farming productivity could decline across much of the world, as a result of reduced rainfall, increased temperatures and increased sea level. Water plays an important role in photosynthesis and helps to transport minerals around plant structures. It is also vital to support livestock. Reduced rainfall and increased temperatures are likely to impact directly on crops and livestock. Rising sea levels could result in large areas of agricultural land becoming submerged or contaminated by seawater. Impacts could be particularly severe for developing countries that rely heavily on farming as a source of income. For example, India, South Africa and Central USA could see a 50% reduction in agricultural productivity. Figure 15. Projected changes to agricultural productivity by 2080 What Does This Mean for Wales? Wales could benefit from an increase in agricultural productivity. Farmers may also be able to grow crops previously only viable in warmer regions (Eg. grapes and lemons). Growing seasons are likely to lengthen. ? Wales Food supply & natural resources • Risk Factors • Increased temperatures • Reduced rainfall in some places • Inland flooding in some places • Coastal submergence • Saltwater intrusion. Source:http://reliefweb.int/sites/reliefweb.int/files/resources/CB3BDC9ECC47A12DC12574DB006547D5-unep_AGR_wrl081007.pdf Don’t Forget the Fish!!! Some fish have moved northwards over the past 30 years by between 50 and 400km, with coldwater species such as monkfish and snake blenny moving the furthest. Source: 2010-2011 MCCIP Annual Report Card Did You Know??? The Welsh growing season has lengthened by about 1 month since 1990. • Adaptation Options • Grow crops suited to the new warmer climate • Grow crops more tolerant to salt • Alternate between livestock and arable farming • Invest in farm buildings to shelter livestock • Invest in irrigation systems • Grow hedges and dig ditches to prevent water runoff. What are the advantages and disadvantages of these?
Biological Diversity Biological diversity is likely to be affected by changing temperature, precipitation and sea level conditions. Biological ecosystems are delicately balanced systems and are particularly susceptible to damage from climate changes. Biodiversity is important because species depend on each other for survival. They act as food sources, as predators and as pollinators, among other roles. A diverse ecosystem is more likely to be robust and able to recover from a variety of disasters. A broad genetic structure also increases survival rates for individual species. • Risk Factors • Higher temperatures may be unsuitable for some species, but offer opportunities for alien species • Increasing sea temperatures could lead to coral bleaching • Increased rainfall and sea level could damage or destroy habitats • Salt water intrusion may be unsuitable for some species. Scientists suggest that damage to coral reefs occurs after temperature increases of 0.5 oc and numbers of species facing extinction increases significantly after a 2oc increase in temperature. Food supply & natural resources Figure 17. Change in Plant Species Richness 1990-2007. 1990 Level Figure 16. Projected impacts of climate change. Source: (Stern Review) http://webarchive.nationalarchives.gov.uk/+/http://www.hm-treasury.gov.uk/d/Executive_Summary.pdf % Change Species Richness Conclusion: Biodiversity in Great Britain has decreased across woodland, grassland and hedgerows, but improved on farmed arable land since 1990. This could be a result of active management by farmers. Source:http://archive.defra.gov.uk/evidence/statistics/environment/wildlife/download/pdf/biyp2010.pdf • Adaptation Options • Protect species and habitats from human activities and alien intrusion • Identify and monitor sensitive sites • Create biodiversity networks • Raise awareness of the importance of protecting biodiversity.
Activities • 1. (Biology 1, Section a) With reference to figure 13, what is the effect of lack of water on plant growth? • 2. (Geography past paper question) Look at figure 15. Outline the factors that influence the sustainability of food supplies in Wales in the next 30 years. Assess their relative importance. • 3. (Humanities Unit 1, outcome 3) Watch the video on http://www.youtube.com/watch?v=lhZlSsj_ge4 How should people and society respond to climate change when considering food supply? • 4. • 5. Go to web page http://www.climate-wales.org.uk/documents/carbon_footprints_final_bilingual.pdf How could agricultural practices in Wales be adapted to minimise greenhouse gas emissions? • 6. What water saving devices could you use in your home? With this in mind, design a poster for young people. • 7. Look at Figure 15 (Agricultural Productivity). Discuss why Welsh agricultural productivity levels might increase. • 8.Look at the poster on http://www.postersaigua.cat/en/doc/poster2_2.pdf. How much water a day do you think you use? Draw a bar chart of how much water you use during drinking, washing and flushing activities each day. • 9. Go to web page http://frontpage.woodland-trust.org.uk/garden/ Look at the “Timings” section. Write a newspaper article that summarises how climate change is affecting the life cycles of oak, winter moth caterpillar and the great tit. • 10. Go to http://www.yourclimateyourlife.org.uk/9_buying_thought.html. How far did the Mackerel travel to your dinner plate? Produce a map using the link to help you calculate the distance travelled. Food supply & natural resources As sea levels rise, coastal habitats such as the one at Penclawdd near near Swansea become “squeezed” between coastal defences and rising sea levels. What could be done to protect such natural habitats?