Download
1 / 46
560 likes | 795 Views
Outline. Temperature Regulation During Exercise Exercise Performance & Exhaustion Heat Acclimation Hydration / Blood Volume. Temperature Regulation During Exercise. Heat Stress & Physiological Temperature Regulation. Gisolfi & Wenger ESSR 1984. Thermoregulatory Control Exercise.

E N D
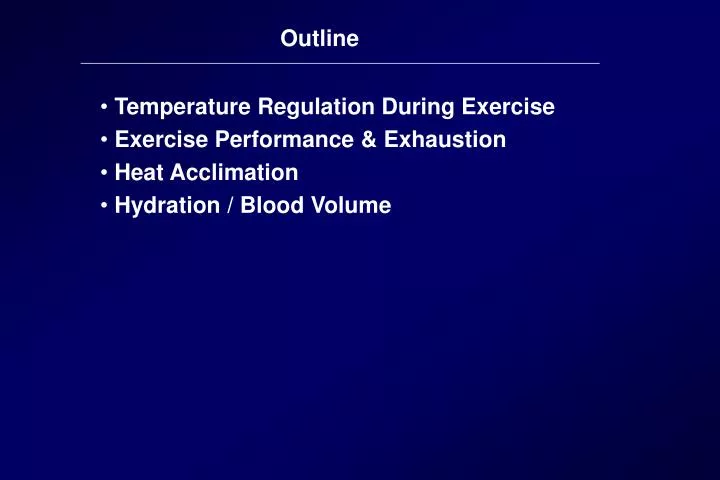
Outline • Temperature Regulation During Exercise • Exercise Performance & Exhaustion • Heat Acclimation • Hydration / Blood Volume
Heat Stress & Physiological Temperature Regulation Gisolfi & Wenger ESSR 1984
Thermoregulatory Control Exercise Set Point Temperature Sweating Thermal Command Signal (Load Error) _ Integrate Afferent Signals Vasodilation + Vasoconstriction Core Temps. Skin Temp. vascular pressures, ions & osmolality, exercise Deep Body Temp. Hypothalamic Temp. Sawka et.al. Handbook of Physiology, 1996
Sweating & “Active” Cutaneous Vasodilation A. Sudomotor Nerve Sweat Gland TCS ACH, VIP Sweating parallels vascular conductance ACH, VIP Vasodilation Sudomotor Nerve B. Sweat Gland ACH TCS Sweating opposite of vascular conductance (e.g., isometric exercise) Non-Thermal Vasodilation (?) Vasodilator Nerve modified from Johnson & Proppe Handbook of Physiology, 1996
Exercise Intensity & Climate Effects on Core Temperature 3 9 . 5 Compensable Heat Stress Uncompensable Heat Stress ) 3 9 . 0 C ° (20 g/min, 1.2 L/h) ( 1 0 0 0 W e r u t Prescriptive Zone 3 8 . 5 a r e p m e (10 g/min, 0.6 L/h) 3 8 . 0 5 0 0 W T e (7 g/min, 0.4 L/h) r 3 5 0 W o C (4 g/min, 0.25 L/h) 3 7 . 5 2 0 0 W 3 7 . 0 3 5 3 0 2 5 2 0 1 0 1 5 W B G T ( ° C ) adapted from, Lind et.al JAP 1963
Summary: Temperature Regulation • Metabolic Rate Dictates Required Heat Loss • Warmer Environment Greater Need for Evaporation • Core Temperature Increase • Exercise Intensity • Climate
Heat Stress Reduces Endurance Exercise (~70-75% of VO2max) 100 90 80 70 60 ~10oC (50oF) Optimum Temperature Time to Exhaustion (min) 4 11 21 31 Environmental Temperature (°C) Galloway & Maughan, MSSE, 1997
2 0 1 5 1 0 5 0 2 3 4 5 Heat Stress Reduces Maximal Aerobic Power (49oC; 20% RH) % Decrease Aerobic Power, Heat VO2 max ( L · min-1) , Temperate Sawka et al. EJAP 1985
Core Temperature at Exhaustion from Heat Strain 100 (n = 747) Uncompensable Heat Stress (hot skin) Many Studies Of Trained Athletes Maron et.al. EJAP 1977 75 (n = 123) % of Subjects Exhausted From Heat Strain 50 Compensable Heat Stress (cool skin) 25 Cheuvront & Haymes Spts. Med. 2001 (n= 776) 0 37.0 38.0 39.0 40.0 41.0 Core Temperature (°C) modified from, Sawka et.al. ESS 2000; Sawka et.al. MSSE 2002
Ta= 30oC Ta= 31oC 41 Ta= 10oC Ta= 31oC 40 Core Temperature (oC) 39 38 10 0 30 20 Minutes of Running Core Temperature at Exhaustion: Champion Runners (maximal effort races) modified from S. Robinson, Pediatrics 1963
Why Does Heat Stress Reduce Exercise Performance? • Circulatory Strain • High Skin Blood Flow, Peripheral Pooling • Stroke Volume, Cardiac Output, Blood Pressure • Central Nervous System(“Critical Core Temperature”) • Brain EEG & Motor EMG Activity, Voluntary Force Activation • Serotonin (5-HT) Accumulation (Plasma Prolactin) • Metabolic • Skeletal Muscle Blood Flow • Substrate Utilization / Metabolite Accumulation
Heat Stress Increases Circulatory Strain by Skin Blood Flow / Volume SKBFmax= 7.8 L/min Rowell Human Circulation 1986
Critical Core Temperature or Circulatory Strain? (60% VO2 max; 40oC) Gonzalez-Alonzo et.al., JAP 1999
Hyperthermia Increases Prolactin, Measure of Central 5-HT Activity (45 min cycling (65%VO2max) Tc >38oC 50 40 20 10 0 * PRL from baseline (ng/ml) 41C 10C Ambient Temperature Brisson et al., JAP, 1991
Hyperthermia Reduces Voluntary Muscle Force Activation Exercise to exhaustion (60%VO2max) in hot or temperate; sustained MVC knee, voluntary activation by electrical stimulation to nervus femoris (Control Tc = 38oC; Hyperthermia Tc = 40oC) 83% 54% Nybo & Nielson JAP 2001
Muscle Metabolism & Heat Stress • Muscle Blood Flow - Unchanged • Muscle Glycogen Utilization – Increased (not all) • Fink et.al. EJAP 1975 • Febbraio JAP 1994 • Jentjens JAP 2001 • Muscle Lactate Accumulation – Increased • Young et.al. JAP 1985 • Febbraio JAP 1994
Summary: Heat Stress & Exercise Performance Reduction C F ? 107.6 42.0 Pathobiology • Heat Stress Reduces Aerobic • Performance • Core Temperature Tolerance • is Climate & Population Specific • Multiple Mechanism Involvement • CV Strain Important • Role of CNS Shutdown? 105.8 41.0 CNS & CV 104.0 40.0 Mechanism(s)? 102.2 39.0 CV 100.4 38.0 37.0 98.6 modified from: Cheuvront & Sawka JKLES 2001
Actions of Heat Acclimation • Thermal Comfort - Improved • Physiological Strain – Reduced • Exercise Performance - Improved • Submaximal - Improved • Maximal - Same
41.0 1 2 3 4 5 6 7 8 9 10 40.0 39.0 Esophageal Temperature (°C) 38.0 37.0 0 20 40 60 Time (min) Heat Acclimation Does Not Alter Core Temperature at Exhaustion(60% VO2max, 40OC, 10% rh; VO2max = 49-74 ml/kg/min) mean Tes = 39.7oC mean Tsk = 38.1oC Nielson et.al. J. Physiol. (London) 1993
Heat Acclimation is Induced by: • Repeated Heat Exposure Over Many Days • Heat Stress Sufficient to Increase Body Temperature & Profuse Sweating • Duration - 100 min / day • Exposure - 4 to 14 days • Specific to Heat Stress • Exercise / Rest • Intensity / Duration • Desert / Tropic
Aerobic Training Induces Partial Heat Acclimation Cohen & Gisolfi, Med Sci Sports14: 46, 1982
Physiology of Heat Acclimation Thermal Comfort - Improved Exercise Performance - Improved Core Temperature – Reduced Tolerance - Unchanged Sweating - Improved Earlier Onset Higher Rate Redistribution (Tropic) Hidromeiosis Resistance(Tropic) Skin Blood Flow -Improved Earlier Onset Higher Rate (Tropic) Metabolic Rate – Lowered Lactate –Lowered Muscle Glycogen – UC or Reduced Cardiovascular Stability - Improved Heart Rate - Lowered Stroke Volume – Increased Cardiac Reserve - Increased Blood Pressure - Better Defended Myocardial Compliance – Increased Myocardial Efficiency - Improved Fluid Balance- Improved Thirst- Improved Electrolyte Loss - Reduced Total Body Water - Increased Plasma Volume - Increased & Better Defended modified from Sawka et.al. Exercise & Sport Science 2000
Acclimation Improves Sweating Response Desert Climate
Acclimation Improves Sweating Responses More than Aerobic Training (65% V02ma : 24o C ) Acclimation Training Training Local Sweat Rate Nadel et.al. JAP 1974
Acclimation Improves Skin Blood Flow Response More than Aerobic Training (75% V02max, 35oC, 75% RH ) Acclimation Training Training Roberts et.al. JAP 1977
Heat Acclimation Reduces Circulatory Strain (14 d;48oC) Better Maintained Increased Reduced Rowell et.al. JAP 1967
Heat Acclimation Reduces Heat Syncope ( n = 45) ( n = 38) Bean & Eichna, Fed. Proc. 1943
Heat Acclimation & Plasma Volume Expansion (Hot/Wet; 40-50% VO2max) Mean Mean % Δ Plasma Volume % Δ TCP Expansion Senay et.al., JAP 1976
60 50 40 30 20 10 0.2 0.6 1.0 1.4 1.8 2.2 Heat Acclimation & Sweat Rate Effects on Sodium Loss Sweat Sodium (meq / L) Unacclimated Acclimated Sweat Rate (mg / cm2 / min) Alan & Wison, JAP 1971
Acclimation Lowers Metabolic Rate during Exercise Sawka et al. ASEM , 1983
Summary: Heat Acclimation & Acquired Thermal Tolerance • Acclimation Reduces Strain & Improves Performance • Acclimation is Specific to Type of Heat Strain • Improved Evaporative Cooling is Critical to Acclimation • Cardiovascular, Fluid, Metabolic Adaptations Support Acclimation
0L Fluid Available 10L Dehydration Reduces Self-Paced Work 97 60 81 50 65 40 49 30 32 20 16 10 0 0 Km Miles oC oF 32 38 43 49 90 100 110 120 Adolph & Associates, Man in Desert, 1945
Dehydration Increases Core Temperature (30ºC, 50% rh) 2 5 % V O m a x 4 5 % V O m a x 6 5 % V O m a x 2 2 2 3 9 EU 3 % BWL 5 % BWL 3 8 Core Temp. (ºC) 3 7 n = 9 n = 9 n = 8 3 6 0 2 0 4 0 0 2 0 4 0 0 2 0 4 0 Exercise Time (min) Montain et al. IJSM, 1998
. 47% VO2max; 49ºC, 20% rh Dehydration Reduces Core Temperature Tolerance 40 * Core Temp. Tolerance (ºC) 39 38 5% BWL Eu Sawka et al. JAP. 1992
1 . 4 2 0 1 6 1 . 0 1 2 0 . 6 8 0 . 2 4 3 9 3 6 3 7 3 8 Dehydration Reduces Sweating & Skin Blood Flow During Exercise-Heat Stress Eu- Eu- FBF (ml /100ml /min) Sweating Rate (mg /cm /min) 5% BWL 5% BWL 3 8 3 7 3 3 6 9 Core Temp. Core Temp. Sawka etal. AJP 1989 Kenney etal. JAP 1990
5 0 0 4 0 0 3 0 0 2 0 0 3 7 . 0 3 8 . 0 3 9 . 0 3 9 3 7 3 8 Dehydration Reduces Sweating Graded to Water Deficit (45% VO2 max;30ºC, 50% rh) (25% VO2 max; 49 ºC, 20% rh) 1.2 Eu 3% BWL Eu 3% BWL 5% BWL 0.8 5% BWL 7% BWL Local Sweating (mg / cm2 /min) Whole Body Sweating (g / m2 / h) 0.4 0.0 Esophageal Temp. (ºC) Rectal Temp. (ºC) Sawka et al. JAP 1985 Montain et al. JAP 1995
Heat & Dehydration Can Reduce Muscle Blood Flow (35°C, 45%rh; 61% VO2 max; 4%BWL) 23 22 Control Cardiac output (L/min) 21 Dehydration 20 19 16 15 Leg Blood Flow (L/min) 14 13 0 20 40 60 80 100 120 140 Time (min) -Gonzalez-Alonzo, et al, J. Physiol (London) 1998
Does Hyperhydration Improve Thermoregulation? Study Temperature Sweat Core Skin Rate Blyth & Burt (1961) nc Moroff & Bass (1965) Greenleaf & Castle (1971) nc nc nc Latzka et.al. (1997) nc nc nc Latzka et.al. (1998) nc nc nc Nielsen (1971) Nielsen (1974) Gisolfi & Copping (1974) nc Nadel et al. (1980) nc Grucza et al. (1987) nc Candas et al. (1988) nc nc nc Lyons et al. (1990) nc Montner et al. (1996) nc nc
Unacclimated Euhydrated = msw = Performance Time Acute Plasma Volume Expansion & Exercise - Heat Exposure (45% VO2 max, 45 °C, 20% rh) NS Albumin Inf. Control Sawka et al. EJAP 1983
Erythrocyte Volume Expansion & Control of Sweating (45% VO2max ; 35º C 45% rh) 1.0 Ss #1, EX I Post-Infusion TS = 34.5 0.8 Local Sweating (mg / cm2 / min) 0.6 Pre-Infusion 0.4 0.2 36 37 38 Core Temperature ( ºC ) Sawka et al. JAP 1987
Summary: Hydration / Blood Volume • Dehydration Increases Thermal & Cardiovascular Strain • Dehydration Reduces Physical Work Performance • Plasma Hyperosmolality & Plasma Hypovolemia Contribute • Hyperhydration & Plasma Volume Expansion Do Not • Improve Thermoregulation or Performance • Erythrocyte Volume Expansion Improves Thermoregulation • & Performance