Download
1 / 1
10 likes | 143 Views
Identification of geneexpression networks in different immunological states. Marc Bonin 1 , Jekaterina Kokatjuhha 1 , Florian Heyl 1 , Karsten Mans 1 , Andreas Grützkau 2 , Biljana Smiljanovic 1 , Till Sörensen 1 , Thomas Häupl 1

E N D
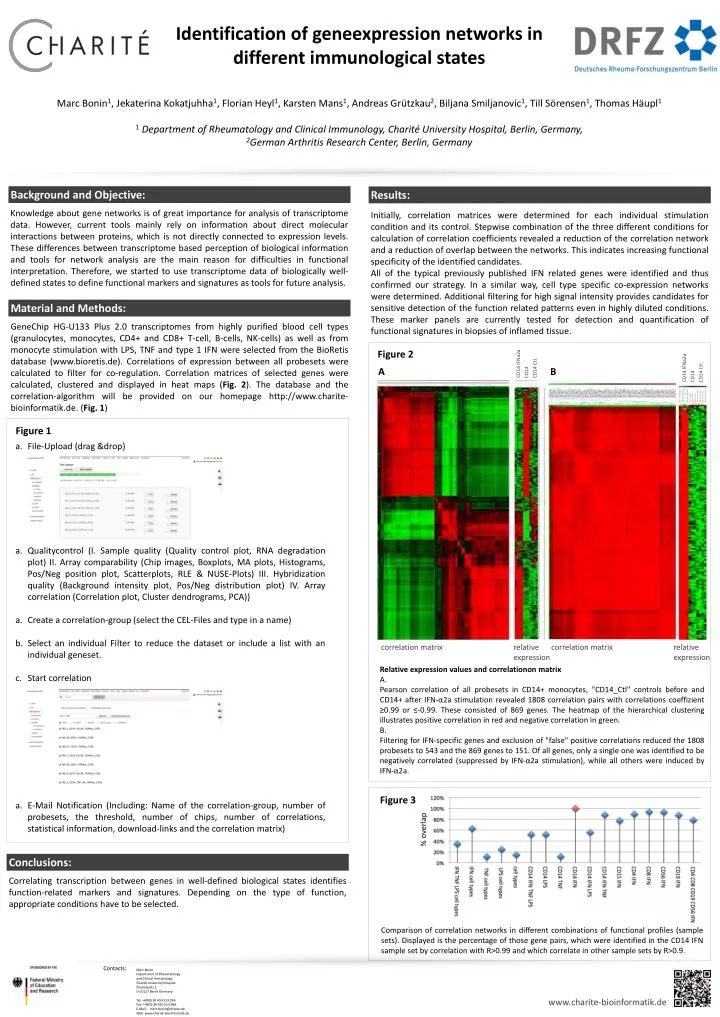
Identification of geneexpression networks in different immunological states Marc Bonin1, Jekaterina Kokatjuhha1, Florian Heyl1, Karsten Mans1, Andreas Grützkau2, Biljana Smiljanovic1, Till Sörensen1, Thomas Häupl1 1 Department of Rheumatology and Clinical Immunology, Charité UniversityHospital, Berlin, Germany, 2German Arthritis Research Center, Berlin, Germany Background and Objective: Results: Knowledge about gene networks is of great importance for analysis of transcriptome data. However, current tools mainly rely on information about direct molecular interactions between proteins, which is not directly connected to expression levels. These differences between transcriptome based perception of biological information and tools for network analysis are the main reason for difficulties in functional interpretation. Therefore, we started to use transcriptome data of biologically well-defined states to define functional markers and signatures as tools for future analysis. Initially, correlation matrices were determined for each individual stimulation condition and its control. Stepwise combination of the three different conditions for calculation of correlation coefficients revealed a reduction of the correlation network and a reduction of overlap between the networks. This indicates increasing functional specificity of the identified candidates. All of the typical previously published IFN related genes were identified and thus confirmed our strategy. In a similar way, cell type specific co-expression networks were determined. Additional filtering for high signal intensity provides candidates for sensitive detection of the function related patterns even in highly diluted conditions. These marker panels are currently tested for detection and quantification of functional signatures in biopsies of inflamed tissue. Material and Methods: GeneChip HG-U133 Plus 2.0 transcriptomes from highly purified blood cell types (granulocytes, monocytes, CD4+ and CD8+ T-cell, B-cells, NK-cells) as well as from monocyte stimulation with LPS, TNF and type 1 IFN were selected from the BioRetis database (www.bioretis.de). Correlations of expression between all probesets were calculated to filter for co-regulation. Correlation matrices of selected genes were calculated, clustered and displayed in heat maps (Fig. 2). The database and the correlation-algorithm will be provided on our homepage http://www.charite-bioinformatik.de. (Fig. 1) Figure 2 CD14 IFNa2a CD14 Ctl. CD14 CD14 IFNa2a A B CD14 Ctl. CD14 Figure 1 • File-Upload (drag &drop) • Qualitycontrol (I. Sample quality (Quality control plot, RNA degradation plot) II. Array comparability (Chip images, Boxplots, MA plots, Histograms, Pos/Neg position plot, Scatterplots, RLE & NUSE-Plots) III. Hybridization quality (Background intensity plot, Pos/Neg distribution plot) IV. Array correlation (Correlation plot, Cluster dendrograms, PCA)) • Create a correlation-group (select the CEL-Files and type in a name) • Select an individual Filter to reduce the dataset or include a list with an individual geneset. • Start correlation • E-Mail Notification (Including: Name of the correlation-group, number of probesets, the threshold, number of chips, number of correlations, statistical information, download-links and the correlation matrix) correlation matrix relative expression correlation matrix relative expression Relative expression values and correlationon matrix A. Pearson correlation of all probesets in CD14+ monocytes, "CD14_Ctl" controls before and CD14+ after IFN-α2a stimulation revealed 1808 correlation pairs with correlations coeffizient ≥0.99 or ≤-0.99. These consisted of 869 genes. The heatmap of the hierarchical clustering illustrates positive correlation in red and negative correlation in green. B. Filtering for IFN-specific genes and exclusion of "false" positive correlations reduced the 1808 probesets to 543 and the 869 genes to 151. Of all genes, only a single one was identified to be negatively correlated (suppressed by IFN-α2a stimulation), while all others were induced by IFN-α2a. Figure 3 % overlap Conclusions: Correlating transcription between genes in well-defined biological states identifies function-related markers and signatures. Depending on the type of function, appropriate conditions have to be selected. Comparison of correlation networks in different combinations of functional profiles (sample sets). Displayed is the percentage of those gene pairs, which were identified in the CD14 IFN sample set by correlation with R>0.99 and which correlate in other sample sets by R>0.9. Contacts: Marc Bonin Department of Rheumatology and Clinical Immunology Charité University Hospital Charitéplatz 1 D-10117 Berlin Germany Tel: +49(0) 30 450 513 296 Fax: +49(0) 30 450 513 968 E-Mail: marc.bonin@charite.de Web: www.charite-bioinformatik.de www.charite-bioinformatik.de