Download
1 / 96
1k likes | 1.19k Views
Segment Reporting and Balanced Scorecard. Chapter 11. Decentralization in Organizations. Benefits of Decentralization. Top management freed to concentrate on strategy. Lower-level managers gain experience in decision-making. Decision-making authority leads to job satisfaction.

E N D
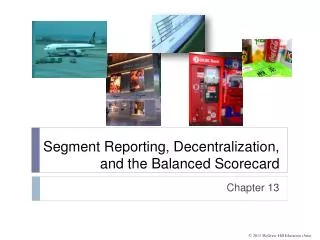
Segment Reporting and Balanced Scorecard Chapter 11
Decentralization in Organizations Benefits of Decentralization Top management freed to concentrate on strategy. Lower-level managers gain experience in decision-making. Decision-making authority leads to job satisfaction. Lower-level decision often based on better information. Improves ability to evaluate managers.
Decentralization in Organizations May be a lack of coordination among autonomous managers. Lower-level managers may make decisions without seeing the “big picture.” Disadvantages of Decentralization Lower-level manager’s objectives may not be those of the organization. May be difficult to spread innovative ideas in the organization.
An Individual Store Quick Mart A Sales Territory A Service Center Decentralization and Segment Reporting Asegmentis any part or activity of an organization about which a manager seeks cost, revenue, or profit data. A segment can be . . .
Cost, Profit, and Investments Centers Cost Center A segment whose manager has control over costs, but not over revenues or investment funds.
Revenues Sales Interest Other Costs Mfg. costs Commissions Salaries Other Cost, Profit, and Investments Centers Profit Center A segment whose manager has control overbothcosts and revenues, but no control over investment funds.
Cost, Profit, and Investments Centers Corporate Headquarters Investment Center A segment whose manager has control over costs, revenues, and investments in operating assets.
Cost, Profit, and Investments Centers Cost Center Profit Center Investment Center Cost, profit, and investment centers areall known as responsibility centers. Responsibility Center
Don’t allocate common costs. Traceable Common A cost that supports more than one segment but that would not go away if any particular segment were eliminated. Costs arise because of the existence of a particular segment Traceable and Common Costs Fixed Costs
No computer division means . . . No computer division manager. Identifying Traceable Fixed Costs Traceable costswould disappear over time if the segment itself disappeared.
No computer division but . . . We still have a company president. Identifying Common Fixed Costs Common costsarise because of overall operation of the company and are not due to the existence of a particular segment.
Let’s look more closely at the Television Division’s income statement. Levels of Segmented Statements Webber, Inc. has two divisions.
Cost of goods sold consists of variable manufacturing costs. Fixed and variable costs are listed in separate sections. Levels of Segmented Statements Our approach to segment reporting uses the contribution format.
Levels of Segmented Statements Our approach to segment reporting uses the contribution format. Segment margin is Television’s contribution to profits.
Levels of Segmented Statements Let’s see how the Television Division fits into Webber, Inc.
Levels of Segmented Statements Common costs should not be allocated to the divisions. These costs would remain even if one of the divisions were eliminated.
Traceable Costs Can Become Common Costs Fixed costs that are traceable on one segmented statement can become common if the company is divided intosmaller segments. Let’s see how this works!
Traceable Costs Can Become Common Costs Webber’s Television Division Product Lines Sales Territories
Traceable Costs Can Become Common Costs We obtained the following information from the Regular and Big Screen segments.
Traceable Costs Can Become Common Costs Fixed costs directly traced to the Television Division $80,000 + $10,000 = $90,000
Traceable Costs Can Become Common Costs Of the $90,000 cost directly traced to the Television Division, $45,000 is traceable to Regular and $35,000 traceable to Big Screen product lines.
Traceable Costs Can Become Common Costs The remaining $10,000 cannot be traced to either the Regular or Big Screen product lines.
Note Saint Shirley and date in attendance ! TRACEABLE Fixed Costs…..
Segment Margin The segment margin is the best gaugeof the long-run profitability of a segment. Profits Time
Omission of some costs in the assignment process. Assignment of costs to segments that are really common costs of the entire organization. The use of inappropriate methods for allocating costs among segments. Hindrances to Proper Cost Assignment The Problems
Product Customer R&D Design Manufacturing Marketing Distribution Service Omission of Costs Costs assigned to a segment should include all costs attributable to that segment from the company’s entirevalue chain. Business Functions Making Up The Value Chain
Failure to trace costs directly Segment 1 Inappropriate Methods of Allocating Costs Among Segments Arbitrarily dividing common costs among segments Inappropriate allocation base Segment 2 Segment 3 Segment 4
Quick Check How much of the common fixed cost of $200,000 can be avoided by eliminating the bar? a. None of it. b. Some of it. c. All of it.
Quick Check How much of the common fixed cost of $200,000 can be avoided by eliminating the bar? a. None of it. b. Some of it. c. All of it. A common fixed cost cannot be eliminated by dropping one of the segments.
Quick Check How much of the common fixed cost of $200,000 can be avoided by going out of business entirely? a. None of it. b. Some of it. c. All of it.
Quick Check How much of the common fixed cost of $200,000 can be avoided by going out of business entirely? a. None of it. b. Some of it. c. All of it. A common fixed cost can be eliminated if all of the segments it supports are eliminated.
Quick Check Suppose square feet is used as the basis for allocating the common fixed cost of $200,000. How much would be allocated to the bar if the bar occupies 1,000 square feet and the restaurant 9,000 square feet? a. 1/10 of $200,000 b. 1/9 of $200,000 c. 9/10 of $200,000 d. 8/9 of $200,000
Quick Check Suppose square feet is used as the basis for allocating the common fixed cost of $200,000. How much would be allocated to the bar if the bar occupies 1,000 square feet and the restaurant 9,000 square feet? a. 1/10 of $200,000 b. 1/9 of $200,000 c. 9/10 of $200,000 d. 8/9 of $200,000 The total amount of the allocation base is 10,000 square feet. So the bar would be allocated 1/10 of the cost.
Allocated on the basis of sales. Hurray, now everything adds up!!! Allocations of Common Costs
Allocations of Common Costs Whoops, what about the bar???
Quick Check Should the bar be eliminated? a. Yes b. No
Quick Check • Should the bar be eliminated? a. Yes b. No
The profit was $44,000 before eliminating the bar. If we eliminate the bar, profit drops to $30,000! Quick Check Should the bar be eliminated? a. Yes b. No
Teaching Note Allocating common fixed costs to the segments those fixed costs support is a recipe for disaster
Net operating income Average operating assets ROI = Return on Investment (ROI) Formula Income before interest and taxes (EBIT) Cash, accounts receivable, inventory, plant and equipment, and other productive assets.
$30,000 $200,000 =15% ROI = Return on Investment (ROI) Formula Regal Company reports the following: Net operating income $ 30,000 Average operating assets $ 200,000 Sales $ 500,000
Net operating income Average operating assets ROI = Net operating income Sales Margin = Sales Average operating assets Turnover = Margin Turnover ROI = Return on Investment (ROI) Formula