Download

1 / 23
230 likes | 384 Views
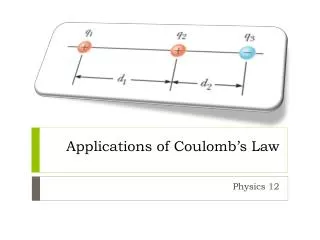
Applications of the First Law. determine all properties of a substance. Equation of state + Energy equation . The energy equation. Internal energy, u Property of substance Function only of the state . u. u = u(T,v). Equation of state relates P, v, and T Any pair defines the state.

E N D
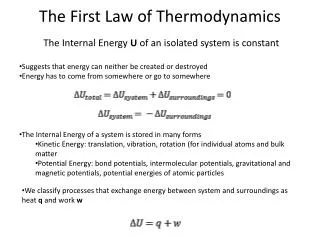
determine all properties of a substance Equation of state + Energy equation The energy equation • Internal energy, u • Property of substance • Function only of the state u u = u(T,v) • Equation of state relates P, v, and T • Any pair defines the state u can be expressed in terms of any pair of these variables e.g. u = u(T,v) v T Energy equation, Defines an energy surface Energy equation cannot be derived from the equation of state but must be determined independently
Must be determined experimentally Can be calculated from the eq. of state using the 2nd law 1st law for a reversible process: In the special case of an isochoric process: Experimental measurements of cv determine the slope of the isochoric line on a u-T-v surface For any reversible process: The derivative can be replaced by cv in any equation Choosing T and v as independent variables
In an isobaric process, Thus, Dividing by and replacing with • Does not refer to a process between two equilibrium states. • Simply a general relation that must hold between quantities that are all properties of a system in any one equilibrium state.
Can be calculated from eqn of state 1st law Case when: Relationships involving enthalpy (choosing T and P as independent variables) Thus, for any reversible process:
Case: or
Earlier… Can be calculated from the eq. of state using the 2nd law Can be calculated from eqn of state Questions: How does the internal energy of a gas depend on its volume? (Gay-Lussac-Joule Experiment) How does the enthalpy of a gas depend on its pressure? (Joule-Thomson Experiment)
There are no instruments that can measure internal energy and enthalpy directly. Therefore, must express the derivatives in terms of measurable properties. Making use of: Measure the rate of change of temperature with volume Similarly,
Thermometer stopcock evacuated gas Water (known mass) Heat losses from tank to surrounding assumed negligible Gay-Lussac-Joule Experiment • Free expansion W=0 • If gas temperature changes, • Heat will flow between gas and water bath, • and reading of thermometer will change • BUT no change in temperature found (or too small to be detected) • Actually, the experiment is not precise due to high heat capacity of water • Direct measurement of temperature change with free expansion is very difficult. Postulate additional property for an ideal gas: no ΔT in free expansion no heat flow to surrounding i.e Q=0. Since W=0 ΔU =0 For ideal gas
Thus, becomes and =0 for an ideal gas ≠0 for a real gas Joule coefficient: Since cv is finite for ideal gas only i.e. If cv can be considered constant,
Initial state P1,V1,T1 Porous plug Final state P2,V2,T2 The Joule-Thomson Experiment (Throttling process) • Process takes place in an insulated cylinder • Specific work done in forcing the gas through plug: • Work done by gas in expansion: • Therefore, total work done is i.e. the initial and final enthalpies are equal Note: cannot say that the enthalpy remains constant during the process, since one cannot speak of the enthalpy of the system while it is passing through non-equilibrium states during the irreversible process.
In the Joule-Thomson experiment, P1 and T1 are kept constant while P2 is varied and T2 is measured. • Since h1=h2=h3, etc., the enthalpy is the same at all these points • The locus of points isenthalpic state of the gas • The numerical value of the slope on the curve at any point is called the Joule-Thomson coefficient μ inversion point
By performing other series of experiments, keeping the initial pressure and temperature the same in each series but varying them from one series to another, a family of curves corresponding to different values of h can be obtained • If the initial temperature is not too great, the curves pass through a maximum point called the inversion point. • The locus of the inversion points is the inversion curve When the properties of real gases an ideal gas, the isenthalpic curves nearly horizontal i.e. μ≈0 or Shown earlier Therefore, for an ideal gas: and
For an ideal gas If cP can be considered constant, Thus, becomes and Since for an ideal gas From eqn of state: Therefore:
Liquefaction of Gases If you want something really cold: you don’t use a refrigerator Instead you put it on dry ice (195 K) Or immerse it in liquid nitrogen (77 K) Or even liquid helium (4.2 K) But how are gases like nitrogen and helium liquefied (or in the case of CO 2 solidified ) in the first place? The most common methods all involve the throttling process.
Dry ice You can liquefy Carbon dioxide at room temperature, simply by compressing it isothermally, and then throttle it back to low pressure and it cools and partially evaporates. However, at pressures < 5.1 atm, liquid CO2 cannot exist; instead the condensed phase is solid, dry ice So to make dry ice, simply hook up a tank of liquid CO2 to a throttling valve and watch the frost form around the nozzle as the gas rushes out.
Liquid Nitrogen • Liquefying nitrogen (air) isn’t so simple • compressing it will only make it denser in a continuous way – no sudden phase transformation to a liquid • Example: Ti = 300K and Pi = 100 atm throttle to Pf = 1 atm • Tf = 280K only • To get any liquid, must start at Ti < 160K
Liquid Helium • To produce Joule-Thomson cooling of in helium, the helium needs to be cooled below 43K. Maximum inversion temperature • Once a gas has been pre-cooled to a temperature lower than the maximum inversion temperature, the optimum pressure from which to start throttling corresponds to a point on the inversion curve. • Starting at this pressure and ending at atmospheric pressure, the process produces the largest temperature drop (which may not be large enough to produce liquefaction)
Consequently, the gas that has been cooled by throttling is used to cool the incoming gas, which after throttling becomes still cooler. • After successive cooling process, the temperature of the gas is lowered to such a temperature that after throttling, it becomes partly liquefied. • countercurrent heat exchanger
Comparison of properties of u and h for a hydrostatic system Internal energy u Enthalpy h Free expansion (irreversible) ui=uf Throttling process (irreversible) hi=hf In general In general Isochoric process: Isobaric process: For an ideal gas: For an ideal gas: Adiabatic process: Adiabatic process:
Other relations: Reversible adiabatic processes Since d’q=0 Therefore: or Cannot be integrated until we know the structure of the gas, which determines γ • Monatomic gases: γis constant • Diatomic and polyatomic gases : γvaries with T A very large change in T produces an appreciable change in γ • e.g. T : 300 3000 K , γ: 1.40 1.29 (for carbon monoxide) For an adiabatic process that involves only a moderate temperature change (as in most cases), γ≈constant Integrating:
isotherm adiabat Slope of any adiabatic curve: Slope for isothermal curves: From Pv=RT, A family of curves representing quasistatic adiabatic processes may be plotted on a P-v diagram by assigning different values to the constant in the equation Pvγ = constant. Since γ > 1, P falls off more rapidly with v for an adiabatic process.
The specific work done in a reversible adiabatic process: But at both limits