Download

1 / 131
1.36k likes | 1.48k Views
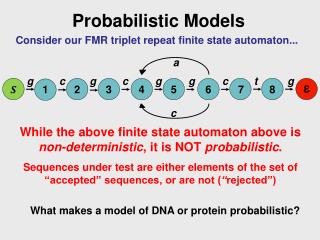
Probabilistic Graphical Models. Probability Theory. Sum rule Product rule From these we have Bayes’ theorem with normalization. What is a graphical model ?. A graphical model is a way of representing probabilistic relationships between random variables.

E N D
Probability Theory • Sum rule • Product rule • From these we have Bayes’ theorem • with normalization
What is a graphical model ? A graphical model is a way of representing probabilistic relationships between random variables. Variables are represented by nodes: Conditional (in)dependencies are represented by (missing) edges: Undirected edges simply give correlations between variables (Markov Random Field or Undirected Graphical model): Directed edges give causality relationships (Bayesian Network or Directed Graphical Model):
Classes of Graphical Models Graphical Models Directed Undirected - Boltzmann Machines - Markov Random Fields - Bayesian Networks • Latent Variable Models - Hidden Markov Models - Generative Topographic Mapping • Non-negative Matrix Factorization
Decomposition • Consider an arbitrary joint distribution • By successive application of the product rule
X1 X2 X3 X4 X6 X5 X7 Basics on graphical models and statisticsGraphs and Families of Probability Distributions There is a family of probability distributions that can be represented with this graph. 1) Every P.D. presenting (at least) the conditional independencies that can be derived from the graph belongs to that family. 2) Every P.D. that can be factorized as p(x1,…,x7)=p(x4|x1,x2) p(x7|x4) p(x5|x4) p(x6|x5,x2) p(x3|x2) belongs to that family.
X X Q m,s X Y X X X Y Q X Basics on graphical models and statisticsBuilding blocks for graphical models p(X)= ??? p(Y|X)= ???? Bayesian approach: every unknown quantity (including parameters) is treated as a random variable. Density estimation Parametric and nonparametric methods Regression Linear, conditional mixture, nonparametric Classification Generative and discriminative approach
Some rules(1) • A graph to represent a regression problem • Plate is used to represent repetition.
Some rules(2) • Suppose we have some parameters • Observations are shaded.
Model Representation (DAG) • Usually, the higher-numbered variables corresponds to terminal nodes of the graph, representing the observations; Lower-numbered nodes are latent variables. • A graph representing the naïve Bayes model.
Conditioning on Evidence • Variables may be hidden (latent) or visible (observed) • Latent variables may have a specific interpretation, or may be introduced to permit a richer class of distribution
lightingcolour surfacecolour image colour “Explaining Away” • C.I. for directed graphs similar, but with one subtlety • Illustration: pixel colour in an image
Naive Bayes Classifiers Task: Classify a new instance based on a tuple of attribute values
Naïve Bayes Classifier: Assumptions • P(cj) • Can be estimated from the frequency of classes in the training examples. • P(x1,x2,…,xn|cj) • O(|X|n•|C|) • Could only be estimated if a very, very large number of training examples was available. Conditional Independence Assumption: Assume that the probability of observing the conjunction of attributes is equal to the product of the individual probabilities.
Flu X1 X2 X3 X4 X5 runnynose sinus cough fever muscle-ache The Naïve Bayes Classifier • Conditional Independence Assumption: features are independent of each other given the class:
Naive Bayes Classifier • It is easy to estimate each of the P(vj)simply by counting thefrequency with which each target value vjoccurs in the training data. • However,estimating the different P(al,a2…an | vj)terms is not feasibleunless we have a very, very large set of training data. • The problem is that thenumber of these terms is equal to the number of possible instances times thenumber of possible target values. • Therefore, we need to see every instance inthe instance space many times in order to obtain reliable estimates. • The naive Bayes classifier is based on the simplifying assumption that theattribute values are conditionally independent given the target value. • For a given the target value of the instance, the probabilityof observing conjunction al,a2...an, is just the product of the probabilitiesfor the individual attributes: • Naive Bayes classifier:
Naive Bayes Classifier - Ex CS464 Introduction to Machine Learning 38
Naive Bayes Classifier -Ex • New instance to classify: (Outlook=sunny, Temperature=cool, Humidity=high, Wind=strong) • Our task is to predict the target value (yes or no) of the target conceptPlayTennis for this new instance. P(Outlook=sunny|vj)P(Temperature=cool|vj) P(Humidity=high|vj)P(Wind=strong|vj)
Naive Bayes Classifier -Ex • P(P1ayTennis = yes) = 9/14 = .64 • P(P1ayTennis = no) = 5/14 = .36 Thus, the naive Bayes classifier assigns the target value PlayTennis = no to thisnew instance, based on the probability estimates learned from the training data. • Furthermore, by normalizing the above quantities to sum to one we can calculatethe conditional probability that the target value is no, given the observed attributevalues. .0206 / (.0206 + .0053) = .795
C X1 X2 X3 X4 X5 X6 Learning the Model • Common practice: maximum likelihood • simply use the frequencies in the data
Problem with Max Likelihood Flu X1 X2 X3 X4 X5 runnynose sinus cough fever muscle-ache • What if we have seen no training cases where patient had no flu and muscle aches? • Zero probabilities cannot be conditioned away, no matter the other evidence!
Estimating Probabilities • P(Wind=strong | PlayTennis=no)by the fraction nc/nwhere n = 5 is the total number of training examples for which PlayTennis=no,and nc= 3 is the number of these for which Wind=strong. • When nc is zero • nc/n will be zero too • this probability term will dominate • To avoid this difficulty we can adopt a Bayesian approach to estimating theprobability, using the m-estimate defined as follows. m-estimate of probability: (nc+ m*p) / (n + m) • if an attribute has k possible values we set p = 1/k . • p=0.5 because Wind has two possible values. • m is called the equivalent sample size • augmenting the n actual observationsby an additional m virtual samples distributed according to p.
Learning to classify text • Learn from examples which articles are of interest • The attributes are the words • Observe the Naïve Bayes assumption just means that we have a random sequence model within each class! • NB classifiers are one of the most effective for this task • Resources for those interested: • Tom Mitchell: Machine Learning (book) Chapter 6.
Using Naive Bayes Classifiers to Classify Text: Basic method • Attributes are text positions, values are words. • Still too many possibilities • Assume that classification is independent of the positions of the words • Use same parameters for each position • Bag of words model
Learning To Classify Text LEARN_NAIVE_BAYES_TEXT(Examples,V) • Examples is a set of text documents along with their target values. V is the set of all possible targetvalues. • This function learns the probability terms P(wk|vj), describing the probability that a randomlydrawn word from a document in class vj will be the English word wk. • It also learns the class priorprobabilities P(vj). • collect all words, punctuation, and other tokens that occur in Examples • Vocabularythe set of all distinct words and other tokens occurring in any text documentfrom Examples
LEARN_NAIVE_BAYES_TEXT(Examples,V) 2. calculate the required P(vj)and P(wk|vj) probability terms For each target value vjin Vdo • docsj the subset of documents from Examples for which the target value is vj • P(vj)|docsj| / |Examples| • Textj a single document created by concatenating all members of docsj • ntotal number of distinct word positions in Examples • for each word wkin Vocabulary • nknumber of times word wkoccurs in Textj • P(wk|vj) (nk+ 1) / (n + |Vocabulary|)
CLASSIFY_NAIVE_BAYES_TEXT(Doc) • Return the estimated target value for the document Doc. • aidenotes the word found in the ith positionwithin Doc. • positionsall word positions in Docthat contain tokens found in Vocabulary • Return VNB, where
# of values ofXi overall fraction in data where Xi=xi,k extent of “smoothing” Smoothing to Avoid Overfitting • Somewhat more subtle version
Why? Naive Bayes: Time Complexity • Training Time: O(|D|Ld + |C||V|)) where Ld is the average length of a document in D. • Assumes V and all Di , ni, and nij pre-computed in O(|D|Ld) time during one pass through all of the data. • Generally just O(|D|Ld) since usually |C||V| < |D|Ld • Test Time: O(|C| Lt) where Lt is the average length of a test document. • Very efficient overall, linearly proportional to the time needed to just read in all the data.