Download
1 / 46
480 likes | 514 Views
Infrared Spectroscopy. CHEM 210. IR Spectroscopy Introduction Spectroscopy is the study of the interaction of matter with the electromagnetic spectrum Electromagnetic radiation displays the properties of both particles and waves The particle component is called a photon

E N D
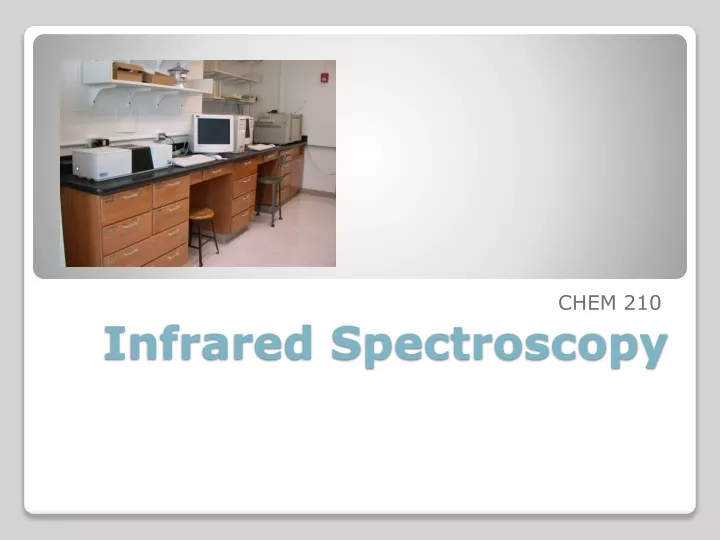
Infrared Spectroscopy CHEM 210
IR Spectroscopy • Introduction • Spectroscopyis the study of the interaction of matter with the electromagnetic spectrum • Electromagnetic radiation displays the properties of both particles and waves • The particle component is called a photon • The energy (E) component of a photon is proportional to the frequency . Where h is Planck’s constant and n is the frequency in Hertz (cycles per second) • E = hn • The term “photon” is implied to mean a small, massless particle that contains a small wave-packet of EM radiation/light – we will use this terminology in the course
IR Spectroscopy • Introduction • Because the speed of light, c, is constant, the frequency, n, (number of cycles of the wave per second) can complete in the same time, must be inversely proportional to how long the oscillation is, or wavelength: • Amplitude, A, describes the wave height, or strength of the oscillation • Because the atomic particles in matter also exhibit wave and particle properties (though opposite in how much) EM radiation can interact with matter in two ways: • Collision – particle-to-particle – energy is lost as heat and movement • Coupling – the wave property of the radiation matches the wave property of the particle and “couple” to the next higher quantum mechanical energy level c ___ hc ___ n = E = hn = l l c = 3 x 1010 cm/s
IR Spectroscopy • Introduction • The entire electromagnetic spectrum is used by chemists: Frequency, nin Hz ~1019 ~1017 ~1015 ~1013 ~1010 ~105 Wavelength, l ~.0001 nm ~0.01 nm 10 nm 1000 nm 0.01 cm 100 m Energy (kcal/mol) > 300 300-30 300-30 ~10-4 ~10-6 g-rays X-rays UV IR Microwave Radio Visible
IR Spectroscopy • Introduction • The IR Spectroscopic Process • The quantum mechanical energy levels observed in IR spectroscopy are those of molecular vibration • We perceive this vibration as heat • When we say a covalent bond between two atoms is of a certain length, we are citing an average because the bond behaves as if it were a vibrating spring connecting the two atoms • For a simple diatomic molecule, this model is easy to visualize:
IR Spectroscopy • Introduction • The IR Spectroscopic Process • There are two types of bond vibration: • Stretch – Vibration or oscillation along the line of the bond • Bend – Vibration or oscillation not along the line of the bond H H H H C C C C C C H H H H H H C C C C H H asymmetric symmetric scissor rock twist wag in plane out of plane
Infrared Spectroscopy • The IR Spectroscopic Process • As a covalent bond oscillates – due to the oscillation of the dipole of the molecule – a varying electromagnetic field is produced • The greater the dipole moment change through the vibration, the more intense the EM field that is generated
Infrared Spectroscopy IR beam from spectrometer “coupled” wave EM oscillating wave from bond vibration • The IR Spectroscopic Process • When a wave of infrared light encounters this oscillating EM field generated by the oscillating dipole of the same frequency, the two waves couple, and IR light is absorbed • The coupled wave now vibrates with twice the amplitude
Infrared Spectroscopy • The IR Spectrum • Each stretching and bending vibration occurs with a characteristic frequency as the atoms and charges involved are different for different bonds The y-axis on an IR spectrum is in units of % transmittance In regions where the EM field of an osc. bond interacts with IR light of the same n – transmittance is low (light is absorbed) In regions where no osc. bond is interacting with IR light, transmittance nears 100%
IR Spectroscopy • The IR Spectrum • The x-axis of the IR spectrum is in units of wavenumbers, n, which is the number of waves per centimeter in units of cm-1 (Remember E = hn or E = hc/l)
IR Spectroscopy • The IR Spectrum • This unit is used rather than wavelength (microns) because wavenumbers are directly proportional to the energy of transition being observed – chemists like this, physicists hate it • High frequencies and high wavenumbers equate higher energy • is quicker to understand than • Short wavelengths equate higher energy • This unit is used rather than frequency as the numbers are more “real” than the exponential units of frequency • IR spectra are observed for what is called the mid-infrared: 400-4000 cm-1 • The peaks are Gaussian distributions of the average energy of a transition
IR Spectroscopy • The IR Spectrum • In general: • Lighter atoms will allow the oscillation to be faster – higher energy • This is especially true of bonds to hydrogen – C-H, N-H and O-H • Stronger bonds will have higher energy oscillations • Triple bonds > double bonds > single bonds in energy Energy/n of oscillation
Infrared Spectroscopy • The IR Spectrum – The detection of different bonds • As opposed to chromatography or other spectroscopic methods, the area of a IR band (or peak) is not directly proportional to concentration of the functional group producing the peak • The intensity of an IR band is affected by two primary factors: • Whether the vibration is one of stretching or bending • Electronegativity difference of the atoms involved in the bond • For both effects, the greater the change in dipole moment in a given vibration or bend, the larger the peak. • The greater the difference in electronegativity between the atoms involved in bonding, the larger the dipole moment • Typically, stretching will change dipole moment more than bending
Infrared Spectroscopy • The IR Spectrum – The detection of different bonds • It is important to make note of peak intensities to show the effect of these factors: • Strong (s) – peak is tall, transmittance is low (0-35 %) • Medium (m) – peak is mid-height (75-35%) • Weak (w) – peak is short, transmittance is high (90-75%) • * Broad (br) – if the Gaussian distribution is abnormally broad • (*this is more for describing a bond that spans many energies) • Exact transmittance values are rarely recorded
Infrared Spectroscopy • II. Infrared Group Analysis • A. General • The primary use of the IR spectrometer is to detect functional groups • Because the IR looks at the interaction of the EM spectrum with actual bonds, it provides a unique qualitative probe into the functionality of a molecule, as functional groups are merely different configurations of different types of bonds • Since most “types” of bonds in covalent molecules have roughly the same energy, i.e., C=C and C=O bonds, C-H and N-H bonds they show up in similar regions of the IR spectrum • Remember all organic functional groups are made of multiple bonds and therefore show up as multiple IR bands (peaks)
Infrared Spectroscopy • II. Infrared Group Analysis • A. General • The four primary regions of the IR spectrum 4000 cm-1 2700 cm-1 2000 cm-1 1600 cm-1 400 cm-1
Infrared Spectroscopy • Specific groups • Alkanes – combination of C-C and C-H bonds • Show various C-C stretches and bends between 1360-1470 cm-1 (m) • C-C bond between methylene carbons (CH2’s) 1450-1470 cm-1 (m) • C-C bond between methylene carbons (CH2’s) and methyl (CH3)1360-1390 cm-1 (m) • Show sp3 C-H between 2800-3000 cm-1 (s) cm -1 Octane
Infrared Spectroscopy • Specific groups • Alkenes – addition of the C=C and vinyl C-H bonds • C=C stretch occurs at 1620-1680 cm-1 and becomes weaker as substitution increases • vinyl C-H stretch occurs at 3000-3100 cm-1 • Note that the bonds of alkane are still present! • The difference between alkane and alkene or alkynyl C-H is important! If the band is slightly above 3000 it is vinyl sp2 C-H or alkynyl sp C-H if it is below it is alkyl sp3 C-H 1-Octene
Infrared Spectroscopy • Specific groups • Alkynes – addition of the C=C and vinyl C-H bonds • C≡C stretch occurs between 2100-2260 cm-1; the strength of this band depends on asymmetry of bond, strongest for terminal alkynes, weakest for symmetrical internal alkynes (w-m) • C-H for terminal alkynes occurs at 3200-3300 cm-1 (s) • Remember internal alkynes ( R-C≡C-R ) would not have this band! 1-Octyne
Infrared Spectroscopy • Specific groups • Aromatics • Due to the delocalization of electrons in the ring, where the bond order between carbons is 1 ½, the stretching frequency for these bonds is slightly lower in energy than normal C=C • These bonds show up as a pair of sharp bands, 1500 (s) & 1600 cm-1 (m), where the lower frequency band is stronger • C-H bonds off the ring show up similar to vinyl C-H at 3000-3100 cm-1 (m) Ethyl benzene
Infrared Spectroscopy • Specific groups • Aromatics • If the region between 1667-2000 cm-1 (w) is free of interference (C=O stretching frequency is in this region) a weak grouping of peaks is observed for aromatic systems • Analysis of this region, called the overtone of bending region, can lead to a determination of the substitution pattern on the aromatic ring Monosubstituted 1,2 disubstituted (ortho or o-) 1,2 disubstituted (meta or m-) 1,4 disubstituted (para or p-)
Infrared Spectroscopy • Specific groups • Unsaturated Systems – substitution patterns • The substitution of aromatics and alkenes can also be discerned through the out-of-plane bending vibration region • However, other peaks often are apparent in this region. These peaks should only be used for reinforcement of what is known or for hypothesizing as to the functional pattern.
Infrared Spectroscopy • Specific groups • Ethers – addition of the C-O-C asymmetric band and vinyl C-H bonds • Show a strong band for the antisymmetric C-O-C stretch at 1050-1150 cm-1 • Otherwise, dominated by the hydrocarbon component of the rest of the molecule Diisopropyl ether
Infrared Spectroscopy • Specific groups • Alcohols • Show a strong, broad band for the O-H stretch from 3200-3400 cm-1 (s, br) this is one of the most recognizable IR bands • Like ethers, show a band for C-O stretch between 1050-1260 cm-1 (s) • This band changes position depending on the substitution of the alcohol: 1° 1075-1000; 2° 1075-1150; 3° 1100-1200; phenol 1180-1260 • The shape is due to the presence of hydrogen bonding 1-butanol
Infrared Spectroscopy • Specific groups • Amines - Primary • Shows the –N-H stretch for NH2 as a doublet between 3200-3500 cm-1 (s-m); symmetric and anti-symmetric modes • -NH2 group shows a deformation band from 1590-1650 cm-1 (w) • Additionally there is a “wag” band at 780-820 cm-1 that is not diagnostic 2-aminopentane
Infrared Spectroscopy • Specific groups • Amines– Secondary • -N-H band for R2N-H occurs at 3200-3500 cm-1 (br, m) as a single sharp peak weaker than –O-H • Tertiary amines (R3N) have no N-H bond and will not have a band in this region pyrrolidine
Infrared Spectroscopy • Specific groups • Aldehydes • Show the C=O (carbonyl) stretch from 1720-1740 cm-1(s) • Band is sensitive to conjugation, as are all carbonyls (upcoming slide) • Also displays a highly unique sp2 C-H stretch as a doublet, 2720 & 2820 cm-1 (w) called a “Fermi doublet” Cyclohexyl carboxaldehyde
Infrared Spectroscopy • Specific groups • Ketones • Simplest of the carbonyl compounds as far as IR spectrum – carbonyl only • C=O stretch occurs at 1705-1725 cm-1 (s) 3-methyl-2-pentanone
Infrared Spectroscopy • Specific groups • Esters • C=O stretch occurs at 1735-1750 cm-1 (s) • Also displays a strong band for C-O at a higher frequency than ethers or alcohols at 1150-1250 cm-1 (s) Ethyl pivalate
Infrared Spectroscopy • Specific groups • Carboxylic Acids: • Gives the messiest of IR spectra • C=O band occurs between 1700-1725 cm-1 • The highly dissociated O-H bond has a broad band from 2400-3500 cm-1 (m, br) covering up to half the IR spectrum in some cases 4-phenylbutyric acid
Infrared Spectroscopy • Specific groups • Acid anhydrides • Coupling of the anhydride though the ether oxygen splits the carbonyl band into two with a separation of 70 cm-1. • Bands are at 1740-1770 cm-1 and 1810-1840 cm-1 (s) • Mixed mode C-O stretch at 1000-1100 cm-1 (s) Propionic anhydride
Infrared Spectroscopy • Specific groups • Acid halides • Dominant band at 1770-1820 cm-1 for C=O (s) • Bonds to halogens, due to their size (see Hooke’s Law derivation) occur at low frequencies, where their presence should be used to reinforce rather than be used for diagnosis, C-Cl is at 600-800 cm-1 (m) Propionyl chloride
Infrared Spectroscopy • Specific groups • Amides • Display features of amines and carbonyl compounds • C=O stretch occurs from 1640-1680 cm-1 • If the amide is primary (-NH2) the N-H stretch occurs from 3200-3500 cm-1 as a doublet • If the amide is secondary (-NHR) the N-H stretch occurs at 3200-3500 cm-1 as a sharp singlet pivalamide
Infrared Spectroscopy • Specific groups • Nitro group (-NO2) • Proper Lewis structure gives a bond order of 1.5 from nitrogen to each oxygen • Two bands are seen (symmetric and asymmetric) at 1300-1380 cm-1 (m-s) and 1500-1570 cm-1 (m-s) • This group is a strong resonance withdrawing group and is itself vulnerable to resonance effects 2-nitropropane
Infrared Spectroscopy • Specific groups – Hydrocarbons • Nitriles (the cyano- or –C≡N group) • Principle group is the carbon nitrogen triple bond at 2100-2280 cm-1 (s) • This peak is usually much more intense than that of the alkyne due to the electronegativity difference between carbon and nitrogen propionitrile
Infrared Spectroscopy • Effects on IR bands • Conjugation – by resonance, conjugation lowers the energy of a double or triple bond. The effect of this is readily observed in the IR spectrum: • Conjugation will lower the observed IR band for a carbonyl from 20-40 cm-1 provided conjugation gives a strong resonance contributor • Inductive effects are usually small, unless coupled with a resonance contributor (note –CH3 and –Cl above)
Infrared Spectroscopy • Effects on IR bands • Steric effects – usually not important in IR spectroscopy, unless they reduce the strength of a bond (usually p) by interfering with proper orbital overlap: • Here the methyl group in the structure at the right causes the carbonyl group to be slightly out of plane, interfering with resonance • Strain effects – changes in bond angle forced by the constraints of a ring will cause a slight change in hybridization, and therefore, bond strength • As bond angle decreases, carbon becomes more electronegative, as well as less sp2 hybridized (bond angle < 120°)
Infrared Spectroscopy • Effects on IR bands • Hydrogen bonding • Hydrogen bonding causes a broadening in the band due to the creation of a continuum of bond energies associated with it • In the solution phase these effects are readily apparent; in the gas phase where these effects disappear or in lieu of steric effects, the band appears as sharp as all other IR bands: • Gas phase spectrum of • 1-butanol • Steric hindrance to H-bonding • in a di-tert-butylphenol • H-bonding can interact with other functional groups to lower frequencies
Infrared Spectroscopy • Brief Look at Mass Spectrometry and Molecular Formulas • A Mass Spectrometer ionizes organic molecules in the gas phase with a beam of electrons • The molecule can lose an electron with the same mass – M+ • OR • Be shattered into fragments M+ + M· • Before NMR, MS was the principle tool for elucidating non-functional group structure – by putting fragment masses together into the whole • Now principally used for determination of isotopic makeup and MW
Infrared Spectroscopy • A Mass Spectrum Molecular Mass of this compound is 249 Signals higher than M+ show the effect of heavier isotopes
Infrared Spectroscopy • A Mass Spectrum • In organic molecules most atoms H, N and O have no appreciable heavier isotopes. • Carbon however contains 1.1% 13C, so if the M+1 peak is 10% as high as M+, there must be 9 carbons in the molecule (9 x 1.1 = 9.9%) • Also C and O are always bound to a total even number of Hs so most MWs are even • Nitrogen causes an odd number of Hs, so if a MW is odd, there are an odd number of nitrogens – 1,3,5….
Infrared Spectroscopy • A Mass Spectrum • If a molecule contains heavier elements, isotopes are far more common and the heavier isotopes make a larger percentage of the whole • Cl is 75% 35Cl and 25% 37Cl so if your M+ signal has a M+2 that is 1/3 as high you have a Cl in your molecule • Br is roughly 50% 79Br and 81Br so if your M+ signal has a M+2 that is equal in height you have a Br in your molecule
Infrared Spectroscopy • Formulas can be used to elucidate structure • Remember that a normal, acyclic hydrocarbon has a formula • CnH2n+2 • If the same carbon chain contains a alkene, it has two less hydrogens so the formula becomes: • CnH2n • If the same carbon chain is made into a ring, it also has two less hydrogens • CnH2n • If the same carbon chain has an alkyne, it has four less hydrogens so the formula becomes: • CnH2n-2
Infrared Spectroscopy • Formulas can be used to elucidate structure • From an extension of this list we can generate a formula for “hydrogen deficiency index” or HDI. • From a given empirical formula we can know the number of double bonds, rings or triple bonds a molecule may contain. • For any given formula: CxHyNzO • HDI = X – ½ Y + ½ Z + 1 • Let’s test the formula on hexane, C6H14: • HDI = 6 – ½ (14) + ½ (0) + 1 • HDI = 6 – 7 + 0 + 1 • HDI = 0 i.e. the formula C6H14 contains 0 rings or double bonds, which we knew • But now you can see this formula can be applied to unknowns!
Hydrogen Deficiency Index Let’s test the equation: HDI = x - y/2 + z/2 + 1 C7H12 C5H5N C14H10 C60 C6H12O6 C6H8O
Hydrogen Deficiency Index Let’s test the equation: HDI = x - y/2 + z/2 + 1 C7H12 C5H5N C14H10 C60 C6H12O6 C6H8O