Download
1 / 25
250 likes | 256 Views
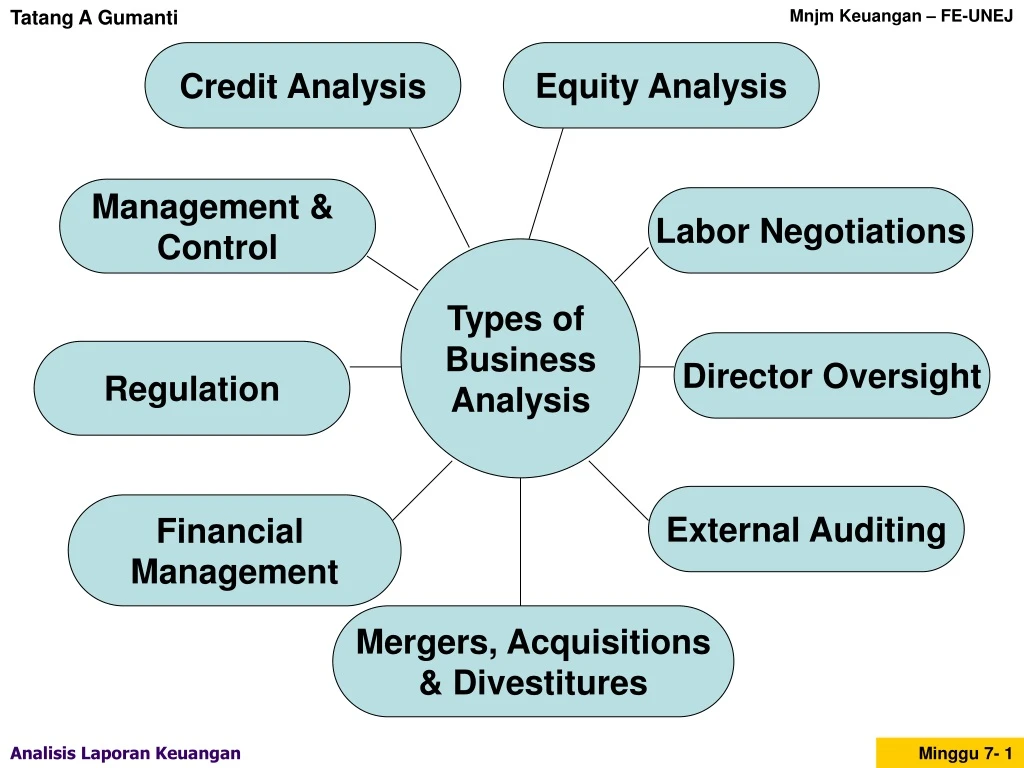
Credit Analysis. Equity Analysis. Management & Control. Labor Negotiations. Types of Business Analysis. Director Oversight. Regulation. External Auditing. Financial Management. Mergers, Acquisitions & Divestitures. Business Analysis. Evaluate Risks. Evaluate Prospects.

E N D
Credit Analysis Equity Analysis Management & Control Labor Negotiations Types of Business Analysis Director Oversight Regulation External Auditing Financial Management Mergers, Acquisitions & Divestitures
Business Analysis Evaluate Risks Evaluate Prospects • Business Decision Makers • Equity investors • Creditors • Managers • Merger and Acquisition Analysts • External Auditors • Directors • Regulators • Employees & Unions • Lawyers
Quantitative Financial Statements Industry Statistics Economic Indicators Regulatory filings Trade reports Qualitative Management Discussion & Analysis Chairperson’s Letter Vision/Mission Statement Financial Press Press Releases Web sites Information Sources forBusiness Analysis
Accounting Analysis Process to evaluate and adjust financial statements to better reflect economic reality Comparability problems — across firms and across time Manager estimation error Distortion problems Earnings management Distortion of business Accounting Risk
Trade Creditors Provide goods or services Most short-term Usually implicit interest Bear risk of default Non-trade Creditors Provide major financing Most long-term Usually explicit interest Bear risk of default Credit Analysis Creditors
Liquidity Ability to meet short-term obligations Focus: Current Financial conditions Current cash flows Liquidity of assets Solvency Ability to meet long-term obligations Focus: Long-term financial conditions Long-term cash flows Extended profitability Credit Analysis Credit worthiness: Ability to honor credit obligations (downside risk)
Seniority - order claims are paid Collateral - asset earmarked for claims Covenants - constraints on debtholders to protect creditors Other provisions - sinking fund requirements, etc. Credit Analysis Debt Characteristics
Passive Investing (beta strategies) Aim: Diversification based on risk propensity & investment horizon Example: Indexing Active Investing (alpha strategies) Aim: Beat the market -- earn above normal stock returns Examples: Technical analysis & Fundamental analysis Credit Analysis
Financial Analysis Process to evaluate financial position and performance using financial statements Profitability analysis—Evaluate return on investments Risk analysis ——— Evaluate riskiness & creditworthiness Sources and uses —Evaluate source & of funds analysis deployment of funds Common tools Ratio analysis Cash flow analysis
Prospective Analysis Process to forecast future payoffs Business Environment & Strategy Analysis Accounting Analysis Financial Analysis Intrinsic Value
Kodak Dec 31, 1998 (In millions, except per share data) Liabilities and Assets Shareholders’ Equity Current Assets Current Liabilities Cash and cash equivalents $ 457 $ 3,906 Payables Marketable securities 43 Short-term borrowings 1,518 Receivables 2,527 Taxes - income and other 593 Inventories 1,424 Dividends payable 142 Deferred income tax charges 855 Deferred income tax credits 19 Other 293 Total current liabilities 6,178 Total current assets 5,599 Other Liabilities Properties Long-term borrowings 504 Land, buildings and equipment at cost 13,482 Post-employment liabilities 2,962 Less: Accumulated depreciation 7,568 Other long-term liabilities 1,032 Net properties 5,914 Deferred income tax credits 69 Other Assets 10,745 Total liabilities Goodwill (net of accumulated amortization of $534) 1,232 Shareholders' Equity Long-term receivables and other non-current assets 1,705 Common stock, par value $2.50 per share, 950,000,000 shares authorized; issued 283 Deferred income tax charges 391,292,760 shares 978 Total Assets $ 14,733 Additional paid in capital 902 6,163 Retained earnings Accumulated other comprehensive loss (111) 7,932 3,944 Treasury stock, as cost, 68,494,402 shares Total shareholders' equity 3,988 Total liabilities and equity $ 14,733
Income Statement Kodak For Year Ended Dec. 31, 1998 (In millions, except per share data) Sales $13,406 Cost of goods sold 7,293 Gross profit 6,113 Selling, general and administrative expenses 3,303 Research and development costs 880 Purchased research and development 42 Restructuring costs and asset impairments - EARNINGS FROM OPERATIONS 1,888 Interest expense 110 Other income (charges) 328 Earnings before income taxes 2,106 Provision for income taxes 716 Earnings from continuing operations 1,390 Gain on sale of discontinued operations - NET EARNINGS $ 1,390
Statement of Shareholders’ Equity Kodak For year ended Dec. 31, 1998 Accumulated Additional Other Common Pail In Retained Comprehensive Treasury Stock Capital Earnings Income (Loss) Stock Total (In millions, except number of shares) 978 914 5,343 (202) (3,872) 3,161 Shareholders’ Equity Dec 31, 1997 - - 1,390 - - 1,390 Net earnings Other comprehensive income (loss): Unrealized holding gains arising during - - - - - period ($122 million pre-tax) 80 Reclassification adjustment for gains included (44) in net earnings ($66 million pre-tax) - - - - - - - - - - 59 Currency translation adjustment Minimum pension liability adjustment - - - - - (4) ($7 million pre-tax) - - - 91 - 91 Other comprehensive income - - - - - 1,481 Comprehensive income (570) - - (570) - - Cash dividends declared - - - - (258) (258) Treasury stock repurchased (3,541,295 shares) Treasury stock issued under employee plans 128 - (58) - - 186 (3,272,713 shares) 46 - 46 - - - Tax reductions - employee plans $3,988 $978 $902 $6,163 ($111) ($3,944) Shareholders’ Equity Dec 31, 1998
Statement of Cash Flows Kodak For year Ended Dec. 31, 1998 (In millions) Cash flows from operating activities: Earnings from continuing operations $ 1,390 Adjustments to reconcile to net cash provided by operating activities: 853 Depreciation and amortization Purchased research and development 42 202 Provisions (benefit) for deferred income taxes (Gain) loss on sale/retirement of assets (166) (Increase) decrease in receivables (1) (43) (Increase) decrease in inventories (Decrease) increase in liabilities excluding borrowings (516) Other items, net (278) 93 Total adjustments Net cash provided by operating activities 1,483 Cash flow from Investing activities: (1,108) Additions to properties 297 Proceeds from sale of assets Cash flows related to sales of businesses (59) Acquisitions, net of cash acquired (949) 162 Marketable securities - sales (182) Marketable securities - purchases Net cash used in investing activities (1,839) Cash flows from financing activities: Net increase (decrease) in borrowings with original maturities of 90 days or less 894 Proceeds from other borrowings 1,133 (1,251) Repayment of other borrowings Dividends to shareholders (569) Exercise of employee stock options 128 Stock repurchase programs (258) Net cash provided by (used in) financing activities 77 Effect of exchange rate changes on cash 8 Net (decrease) increase in cash and cash equivalents (271)
Statement of Cash Flows for Year Ended Dec. 31, 1998 Operating Cash flows $ 1,483 Investing Cash flows (1,839) Financing Cash flows 77 Exchange rate changes on cash 8 Net Change in Cash $ (271) Cash Balance, Dec. 31, 1997 728 Cash Balance, Dec. 31, 1998 $ 457 Balance Sheet Dec. 31, 1997 Assets Cash $ 728 Non-Cash Assets 12,417 Total Assets $13,145 Liabilities & Equity Total liabilities $ 9,984 Equity: Share Capital 1,892 Retained Earnings 5,141 Treasury Stock (3,872) Total equity $ 3,161 Liabilities & Equity $13,145 Balance Sheet Dec. 31, 1998 Assets Cash $ 457 Non-Cash Assets 14,276 Total Assets $14,733 Liabilities & Equity Total liabilities $10,745 Equity: Share Capital 1,880 Retained Earnings 6,052 Treasury Stock (3,944) Total equity $ 3,988 Liabilities & Equity $14,733 Income Statement for Year Ended Dec. 31, 1998 Sales $13,406 Expenses 12,016 Net Earnings $ 1,390 Other Comprehensive Income 91 Comprehensive Income $ 1,481 Statement of Shareholders’ Equity for Year Ended Dec. 31, 1998 Share Capital, Dec. 31, 1997 $ 1,892 Adjustments/Stock Issue (12) Share Capital, Dec. 31, 1998 $ 1,880 Retained Earnings, Dec. 31, 1997 $ 5,141 Add: Comprehensive Income 1,481 Less: Dividends (570) Retained Earnings, Dec. 31, 1998 $ 6,052 Treasury Stock, Dec. 31, 1997 $ 3,872 Treasury Stock Issued 186 Treasury Stock Repurchased (258) Treasury Stock, Dec. 31, 1998 $ 3,944 Financial Statement Links - Kodak (Period of time) (Period of time) (Period of time)
Analysis Preview Year-to-Year Analysis Kodak's Comparative Income Statements Change Change 1998 1997 (in mil.) % Sales (7.8)% $ 13,406 $14,538 ($ 1,132) Cost of goods sold 7,293 7,976 (683) (8.5) $ 6,113 $ 6,562 ($ 449) Gross profit (6.8) Operating Expenses: 3,912 Selling, general and admin. 3,303 (609) (15.6) 1,230 Research and development 922 (308) (25.0) 1,290 Restructuring costs - (1,290) (100) Earnings from operations 1,352 $ 1,888 $ 130 $ 1,758 Interest Expense 110 98 12 (12.2) Other income (charges) 328 21 307 1,461 Earnings before income taxes $ 2,106 $ 53 $2,053 3,873 48 Provision for income taxes 716 668 1,391 Net earnings 27,700 $ 1,390 $ 5 $1,385
Business Environment & Strategy Analysis Industry Analysis Strategy Analysis Prospective Analysis Accounting Analysis Financial Analysis Analysis of Sources &Uses of Funds Risk Analysis Profitability Analysis Cost of Capital Estimate Intrinsic Value
Financial Reporting Environment Industry Practices Alternative Information Sources Regulators Economy and Industry Information FASB AICPA GAAP Managers Voluntary Disclosure Users Analysts Statutory Financial Reports (Financial Statements) Investors and Creditors Enforcement and Monitoring Mechanisms SEC Litigation Corporate Governance Auditors Other Users
Financial Statements Reflect Business Activities Planning • Financing • Current: • Notes Payable • Accounts Payable • Salaries Payable • Income Tax Payable Noncurrent: • Bonds Payable • Common Stock • Retained Earnings • Investing • Current: • Cash • Accounts Receivable • Inventories • Marketable Securities Noncurrent: • Land, Buildings, & Equipment • Patents • Investments Operating • Sales • Cost of Goods Sold • Selling Expense • Administrative Expense • Interest Expense • Income Tax Expense Net Income Liabilities & Equity Income statement Assets Cash Flow Balance Sheet Balance Sheet Statement of Cash Flows Statement of Shareholders’ Equity
Analysis Preview Yr1 Yr2 Yr3 Purpose: Evaluation of consecutive financial statements Output: Direction, speed, & extent of any trend(s) Types: Year-to-year Change Analysis Index-Number Trend Analysis Comparative Analysis
Analysis Preview Year-to-Year Analysis Kodak's Comparative Income Statements Change Change 1998 1997 (in mil.) % Sales (7.8)% $ 13,406 $14,538 ($ 1,132) Cost of goods sold 7,293 7,976 (683) (8.5) $ 6,113 $ 6,562 ($ 449) Gross profit (6.8) Operating Expenses: 3,912 Selling, general and admin. 3,303 (609) (15.6) 1,230 Research and development 922 (308) (25.0) 1,290 Restructuring costs - (1,290) (100) Earnings from operations 1,352 $ 1,888 $ 130 $ 1,758 Interest Expense 110 98 12 (12.2) Other income (charges) 328 21 307 1,461 Earnings before income taxes $ 2,106 $ 53 $2,053 3,873 48 Provision for income taxes 716 668 1,391 Net earnings 27,700 $ 1,390 $ 5 $1,385
Analysis Preview Index-Number Trend Analysis Kodak's Index - Number Trend Series (base year 1994) 1998 1997 1996 1995 1994 Sales 99 107 117 110 100 Total operating expenses 94 118 115 106 100 Earnings from operations 144 10 141 148 100 Net earnings 249 1 182 224 100 Total assets 98 88 96 97 100 Shareholders' equity 99 79 118 127 100
Analysis Preview Common-Size Analysis Purpose : Evaluation of internal makeup of financial statements Evaluation of financial statement accounts across companies Output: Proportionate size of assets, liabilities, equity, revenues, & expenses
Analysis Preview Common-Size Analysis Kodak's Common-Size Income Statements 1998 1997 Sales 100.0% 100.0% Cost of goods sold 54.4 54.9 Gross profit 45.6% 45.1% Selling, general and administrative expenses 24.6 26.9 Research and development costs 6.9 8.5 Restructuring Costs 0 8.9 Earnings from operations 14.1% 0.9% Interest expense 0.8 0.7 Other income 2.4 0.1 Earnings before income taxes 15.7% 0.3% Provision for income taxes 5.3 0.3 Net earnings 10.4% 0.0%
Analysis Preview Ratio Analysis Purpose : Evaluate relation between two or more economically important items (one starting point for further analysis) Output: Mathematical expression of relation between two or more items Cautions: Prior Accounting analysis is important Interpretation is key -- long vs short term & benchmarking