Download
1 / 14
140 likes | 147 Views
A new FIA method is described for the determination of L u00f1 arginine in blood and urine samples. The method is characterized by sensitivity, sim- plicity and fast, it is based on formation a red color product between L- arginine and u2022-naphthol in the presence of sodium hypobromite, as oxidizing agent which oxidized the reagent of u2022- naphthol, the oxidizing product condenses with L u00f1 arginine, the colored product measured at u00cemax 501 nm. Chemical and physical parameters have been investigated, the linear dy- namic range of L-arginine was 3-1400u00b5g.ml -1 while correlation coefficient (r) was 0.9979, percentage linearity (r 2%) C.O.D. was 99.58 %. Limit of detection (1u00b5g.ml -1) for the lowest concentration in the linear dynamic range of the calibration graph with RSD% (n=10) uf03c 2% for concentration 60 and 800u00b5g. ml -1 . The method has been successfully applied for the estimation of L- Arginine in blood & urine samples and the FIA procedure is able to estimate these samples with a through put of 52 sample/ h. A comparison was made between the official method with the developed method via the paired t-test and F- test. It u00eds indicate that there were no worthy differences between either methods. therefore the new developed method of FIA can be adopted as a substitute method for determination of L-arginine.

E N D
id10174046 pdfMachine by Broadgun Software - a great PDF writer! - a great PDF creator! - http://www.pdfmachine.com http://www.broadgun.com Volume 16 Issue 7 ISSN : 0974-7419 Analytical Analytical CHEMISTRY Analytical Analytical CHEMISTRY An Indian Journal Full Paper Full Paper ACAIJ, 16(7) 2016 [305-318] Determination of L – arginine in human urine and blood serum via CFIA / merging zones technique with spectrophotometric detection Bushra B.Qassim University of Baghdad, Collage of Science, Department of Chemistry E-mail: bushra.raghad@yahoo.com ABSTRACT KEYWORDS Sakaguchi reagent; CFIA; Biological samples; Spectrophotometric determination. A new FIA method is described for the determination of L – arginine in blood and urine samples. The method is characterized by sensitivity, sim- plicity and fast, it is based on formation a red color product between L- arginine and á-naphthol in the presence of sodium hypobromite, as oxidiz- ing agent which oxidized the reagent of á- naphthol, the oxidizing product condenses with L – arginine, the colored product measured at ëmax 501 nm. Chemical and physical parameters have been investigated, the linear dy- namic range of L-arginine was 3-1400µg.ml-1 while correlation coefficient (r) was 0.9979, percentage linearity (r2%) C.O.D. was 99.58 %. Limit of detection (1µg.ml-1) for the lowest concentration in the linear dynamic range of the calibration graph with RSD% (n=10) 2% for concentration 60 and 800µg. ml-1. The method has been successfully applied for the estimation of L- Arginine in blood & urine samples and the FIA procedure is able to estimate these samples with a through put of 52 sample/ h. A comparison was made between the official method with the developed method via the paired t-test and F- test. It’s indicate that there were no worthy differences between either methods. therefore the new developed method of FIA can be adopted as a substitute method for determination of L-arginine. 2016 Trade Science Inc. - INDIA INTRODUCTION in the urine of healthy adults[3]. L – arginine is an essential amino acid particularly for the developing addescents which had been documented since the 1889 s. L – arginine was involved in numerous metabolic path ways : comprising the synthesis of urea, creatine and agmatine and also the physiological forerunner of nitric oxide, a mediator released by vascular endothelial cells. That accounts for the biological activity of endothelium – derived relaxing factor metabolic disorders of arginine catabolism can lead to periodical and enduring hyperarginineernia with the last one, certain cases but not all of them are Amino acids (AAS) resulting from the digestion of proteinaceous food in the gastrointestinal tract of human beings are mainly used for the biosynthesis of proteins and peptides. They are catabolized to a major extant in the liver to yield mainly 2-oxo acids and glucose which are further metabolized and urea[1,2]. Low amount of AAS entering the kidney with the blood stream are neither metabolized nor re absorbed in the glomerular nephrons of the kidney. On average quantities of0.4 – 1.1g of free AAS are daily excreted
Determination of L – arginine in human urine and blood serum . 306 ACAIJ, 16(7) 2016 Full Paper Full Paper mentally[2,4]. It was necessary to take worthy maintenance with the quantity of nourishment and pharmaceutical preparations (regarding the amount of amino acid). The determination of guanido acetic acid in biological material by means of quantitative Sakaguchi reaction has so far depended upon the use of adsorbents to free the solutions of any arginine which may be present[5,6]. A more direct method for the removal of arginine from biological fluids would seem to be by enzymatic hydrolysis with the enzyme, arginase. It’s application to the determination of arginine in dog blood[7] and in protein hydrolysates[8] have been already described. When the same analytical procedure was applied to fresh human urine and to 24 hour collections of urine, it was found that the intensity of the Sakaguchi reaction was the same. Whether or not the urine had been previously treated with arginase[9]. This method relies upon the formation of a red colored complex produced by arginine and other monosubstituted guanido compounds in the presence of á– naphthol and alkaline hypobromite[10]. Several analytical methods[11-17] had been developed for the determination of arginine and the majorities of them were applicable to microgram amounts and have a narrow dynamic range of determination. Among these were HPLC with UV – detection and turbidimetry. Pulsed amperometry for determination of arginine uses high anodic potential spectrophotometry[18-22]. Ionization mass spectrometry has also been used for the determination of arginine with high sensitivity but suffers from a more time overriding techniques and expensive instrumentation. Chemiluminescence was an attractive analytical method due to its sensitivity, ease and simplified of operation especially to trace biological substance analysis but this method had not been widely used in practice. Some studies[13,18] involved enzymes which made the experiment more expensive and required more care for maintaining the activity of the enzymes. The aim of our study was (i) to demonstrate the applicability of FIA / Merging Zones techniques for the determination of L – arginine in human urine and blood serum without treatment of samples that needs 20 min only for determination (ii) to measure quantities of daily L – arginine in healthy adults (iii) to determine whether L – arginine are still after a fasting period using colorimetric estimation of L – arginine as described by Sakaguchi[5]. (iv) to estimate the amounts of L- arginine in urine and serum following simulation by pharmaceutical formulations intake. polarization, Scheme1 : Schematic diagram of FIA-Merging zones system where, Sp with FC; spectrophotometry with flow cell, R.C.; reaction coil, I.V.; injection valve, P.; Peristaltic pump; R.; recorder and w.; waste (L1, Arg. in NaOH) (L2, á-naphthol with urea) (L3, NaOBr) Analytical Analytical CHEMISTRY Analytical Analytical CHEMISTRY An Indian Journal
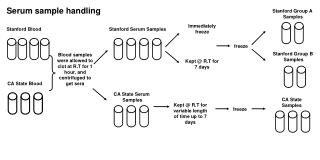
ACAIJ, 16(7) 2016 Bushra B.Qassim 307 Full Paper Full Paper EXPERIMENTAL prepared by dissolving 5 g of NaOH (1.25 M) in 100 mL distilled water, then added 0.64 mL Br2 (density = 3.103 g.cm-3). A stock solution of sodium hydroxide (40 g.mol-1, BDH) (2.5 M) was prepared by dissolving 10 g of NaOH in 100 mL volumetric flask in distilled water. A stock solution of -naphthol (M.wt = 144.17 g.mol-1, BDH) (1.4×10⁻³M) was prepared by dissolving 0.02 g of -naphthol in 95 mL of ethanol, shacked well and completed to 100 mL in volumetric flask with distilled water. Taking 20 mL of this standard solution and diluted with distilled water in 100 mL volumetric flask. A 10% urea solution A 10% urea solution was prepared by dissolving 10 g of urea (BDH) in 100 mL of distilled water in calibrated flask to prepare 1.67 M urea. Physiological samples Urine & blood samples were provide by four healthy adults taking the drug of arginine as a strainer no.1 [male 48 years old, 80Kg], no. 2 [male 27 years old, 75Kg], no. 3 [female 50 years old, 85 Kg], no. 4 female [25 years old, 55 Kg]. Collection and treatment of urine and serum Urine samples Urine samples was collected and separation by centrifuge at 3000 rpm for 20 second to remove any precipitant found in urine then used immediately in the analysis. Blood samples Blood samples was collected and stored for 10 min in room temperature to form the clot which make the separation process easier, then put the blood samples in centrifuge at 3000 rpm for 15 min to separation serum from blood. Take the serum and treated with ammonium sulfate 65% to remove all proteins that effect on the analysis, the advantages of using NH4SO4, ammonium sulfate[23] in precipitation of proteins are ; 1 / it does not have a large heat of solution, allowing heat generated to be easily dissipated, 2 / at saturation, it is of sufficiently high molarity that it cause the precipitation of most Apparatus For batch procedure, was carried out on shimadzu UV- 1800 (Japan) double beam spectrophotometer and quartz cell with an optical path length of 1 cm. For FIA procedure used a quartz flow cell with 100µl internal volume. A peristaltic pump / one line (Master flex C/L, USA) which was used to transport the reagent solutions, all spectral were conducted on a Optima visible SP- 300 digital single beam recording spectrophotometer (Japan), for the absorbance measurements as peak height through (Kompensograph, C1032, Simens) or absorbance with digital multimeter (DT 9205A, China). Injection valve (homemade) (six –three ways which including 3-loops made of Teflon) that loaded with sample with few drops of sodium hydroxide (loop 1), á-naphthol and urea (loop2) and sodium hypobromite (loop 3) based on merging- zones technique were employed using suitable injection volumes of standard solutions and sample. Flexible vinyl tubes of 0.25 mm internal diameter were used for the peristaltic pump, the reaction coil was made of glass with internal diameter of 2 mm. The distilled water was chosen to be a carrier which combined with injection sample (blood or urine) in basic solution of sodium hydroxide (L1), and they merged with the reagent of á-naphthol with urea (L 2), then mixed with sodium hypobromite (L3). The chemicals were merged in reaction coil with length of 50 cm, injection sample of 42.19µl. Flow rate of carrier of 5.5 ml.min-1, the colored product formed was measured at 501 nm as a peak height in mV. Flow system (scheme (1)) that used for detection and determination of arginine in blood and urine samples. Materials and reagents Analytical reagents grade chemicals and distilled water were used throughout. A standard solution of L-Arginine (C6H14N4O2, 174.2 g.mol-1, BDH) (2000 µg.ml-1 = 1.15×10⁻²M) was transferred to a 200 mL volumetric flask and was dissolved and completed to the mark with distilled water, more dilution were made when it were necessary. Sodium hypobromite (0.25 M NaOBr) Sodium hypobromite (0.25 M NaOBr) was Analytical Analytical CHEMISTRY Analytical Analytical CHEMISTRY An Indian Journal
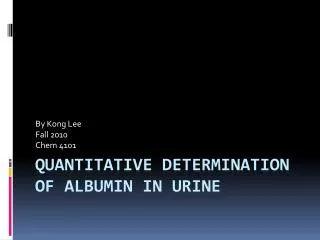
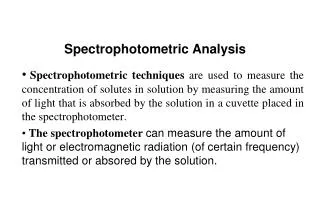
Determination of L – arginine in human urine and blood serum . 308 ACAIJ, 16(7) 2016 Full Paper Full Paper protein, 3 / its concentrated solutions are generally bacteriostatic, 4 / in solution, it protects most proteins from denaturation. However, proteins in cell culture medium containing surfactants as pluronic f -68 cannot be precipited with ammonium sulfate. 5 / its saturated solution (4.04M) at (20C) has a density of 1.235 g. cm-3 that does not interfere with the sedimentation of most precipitated proteins by centrifugation. Take the solution and put it in centrifuge for 20 min at 3000 rpm., then separate the serum from the precipitant and used in the analysis. Methodology The manifold system for determination of arginine via spectrophotometric detection with á-naphthol to form red colored product is composed of one line as shown in scheme (1), the line constitutes the carrier stream (distilled water), which leads to the injection valve, which allows the use of 42.19µl injection sample & flow rate 5.5 ml. min-1. the carrier merged with injection sample (blood & urine) in basic medium of sodium hydroxide L1, and they merged with the reagent Scheme2 : The proposed mechanism of the reaction between L-arginine with -naphthol in an alkaline medium Figure1 : Continuous variation plot of the reaction between L-arginine and -naphthol using batch procedure Analytical Analytical CHEMISTRY Analytical Analytical CHEMISTRY An Indian Journal
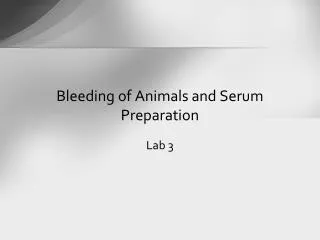
ACAIJ, 16(7) 2016 Bushra B.Qassim 309 Full Paper Full Paper Spectrophotometric study A dilute solution of arginine (35µg.ml-1) when mixed with sodium hydroxide (2.5M) in ice bath (5 0C) as reaction medium then followed by adding of á-naphthol, after that added of sodium hypobromait as oxidizing agent. A red color product formed then added urea to remove the excess of sodium hypobromait and to stabilized the color of the product for at less 1 hour[25]. The product shows maximum peak at 501 nm against reagent blank as shown in Figure 2. Batch spectrophotometric determination In the experiments, 20 µg.ml-1 of arginine was taken in 25 ml volume and performed by change one factor at a time and keeping the other conditions fixed and á-naphthol with urea. L 2, then mixed with sodium hypobromite L3. All of these chemicals were merged in reaction coil with length of 50 cm in ice bath with stirring (50C), injection sample of 42.19µl. Flow rate of carrier of 5.5 ml.min-1, the colored product formed was measured at 501 nm as peak height in mV. Survey through the literature[24] there were several mechanism were reported, but the author believe that the most possible mechanisms as shown in scheme (2). The stiocheiometry of the reaction between L- arginine and á-naphthol was tested using continuous variation method. In this method, Job’s method was applied by putting 1 to 9 mL of 20 µg.mL-1 of arginine in a series of 25 mL volumetric flask, and put in ice then adding 1 mL of 2.5 M sodium hydroxide and 9 to 1 mL of 1.4×10⁻³M á-naphthol, mix well for 2 min, then added 0.1 mL of sodium hypobromite (0.25 M), the solution was shaken for 4 sec., then putting 1 mL of urea (1.67 M) and thoroughly mixed, after 10 min the absorbance was measured versus reagent blank at ëmax 501 nm, as shown in Figure 1 The results obtained from Figures 1 show that 1:2 colored product was formed and measured at 501nm. TABLE 1 : Stability constant of colored product of arginine with á-naphthol in presence of sodium hypobromite as oxi- dizing agent in an alkaline medium K(L.mol-1) Am As C(M) á or (M-1) Arginine 1.148x10⁻⁴ 2x10¹⁰ 0.772 0.699 0.095 *Average of five determination Figure 2 : (A) Absorption spectra of the colored product, 35 µg.mL-1 of L-arginine against reagent blank and(B) blank against distilled water Analytical Analytical CHEMISTRY Analytical Analytical CHEMISTRY An Indian Journal
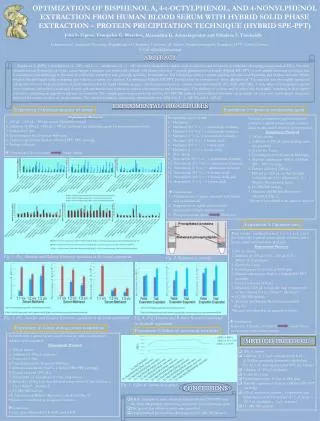
Determination of L – arginine in human urine and blood serum . 310 ACAIJ, 16(7) 2016 Full Paper Full Paper optimized. Series of dilute solutions of sodium hydroxide (0.1-1.2M) were prepared. It can be seen that there is an increase in sensitivity of response within increase of sodium hydroxide concentration as indicate in Figure 3. Therefore, 1 M of sodium hydroxide was chosen as the optimum concentration for the work conducted in this research. Effect of urea concentration Series of urea solutions of (0.1-0.8M) was prepared. Each measurement was repeated for three times, Figure 4 shows the results obtained which indicate that the response is increase with the increase of urea concentration and the response almost stable when the concentration reach to 0.5M and more, from this point we suggest that the 0.3 M was the perfect concentration of urea which gave the highest absorbance because of this reason 0.3M was chosen for subsequent experimental. Effect of á-naphthol concentration The effect of different concentrations of á-naphthol Figure 3 : Effect of the concentration of NaOH in (M) Figure 4 : Effect of urea concentration in (M) Figure 6 : Effect of sodium hypobromite concentration Figure 5 : Effect of á-naphthol concentration in (M) observing the influence of the product on the absorbance. Optimization of chemical parameters Effect of sodium hydroxide The effect of sodium hydroxide of the reaction was Figure 7 : Effect of variation of concentration of á-naphthol expressed as peak height (mV) Analytical Analytical CHEMISTRY Analytical Analytical CHEMISTRY An Indian Journal
ACAIJ, 16(7) 2016 Bushra B.Qassim 311 Full Paper Full Paper Figure 9 : Effect of sodium hydroxide concentration on peak height for oxidation condensation reaction of L-arginine Figure 10 : Effect of different concentration of urea on the reaction of L- arginine with á-naphthol using sodium hypo- bromite as oxidizing agent Figure 8 : a / Effect of sodium hypobromite concentration b / Response profile (1x10⁻⁴-1.4x10⁻³M) was studied. The results obtained indicate that 8x10⁻⁴M was optimum concentration with the best absorbance as shown in Figure 5. Effect of sodium hypobromite concentration The effect of sodium hypobromite was investigated. Figure 6 shows that an increasing in the sodium hypobromite concentration which causing decrease in sensitivity, that the optimum concentration of sodium hypobromite was 0.1M gave regular responses and was chosen for subsequent experimental. FIA –merging zones spectrophotometric Figure 11 : Effect of flow rate on peak height in mV determination The batch method for the determination of arginine was chosen as a basis to develop a FIA procedure. The manifold used for the determination of arginine was designed to provide variable reaction parameter for enlargement of the absorbance signal generated by the reaction of L-arginine with á-naphthol and urea in ice path, then added hypobromait as oxidizing agent. Optimum absorbance expressed as peak height in mv Analytical Analytical CHEMISTRY Analytical Analytical CHEMISTRY An Indian Journal
Determination of L – arginine in human urine and blood serum . 312 ACAIJ, 16(7) 2016 Full Paper Full Paper TABLE 2 : Effect of -naphthol concentration on the measurement of peak heigh for [L-arginine- -naphthol -OBr-] system Confidence interval of the mean Absorbance as peak ) x ( (n=3) mV Standard deviation n-1 Concentration of [ - naph.] M Repeatability %RSD height n 1 x t . 0 05 n 1×10⁻⁴ 495.16 49 1.00 2.04 5×10⁻⁴ 1024.45 102 1.80 1.76 8×10⁻⁴ 1200.00 120 0.00 0.00 1×10⁻³ 1685.60 168 1.28 0.76 1.2×10⁻³ 1712.90 171 1.16 0.68 1.3×10⁻³ 1274.76 127 2.31 1.88 1.4×10⁻³ 1300.00 130 0.00 0.00 1.5×10⁻³ 1210.00 121 0.00 0.00 TABLE 3 : Effect of sodium hydroxide on peak height using optimum parameters Confidence interval of the mean Absorbance as peak ) x ( (n=3) mV Standard deviation n-1 Concentration of sodium hydroxide in ( M ) Repeatability %RSD height x t n 1 . 0 05 n 0.1 61 0.00 0.00 61±0.00 0.3 86 0.07 0.08 86±0.18 0.5 123 0.00 0.00 123±0.00 1 148 1.00 0.68 148±2.53 1.5 158 0.10 0.06 158±0.25 2 341 0.00 0.00 341±0.00 2.5 345 0.02 0.62 345±0.05 3 271 0.00 0.00 271±0.00 (n=3) was obtained when the sample arginine (35µg.ml- 1) and sodium hydroxide (2.5M), a reagent (1.4x10- 3M of á-naphthol in 1.67M of urea), 0.25M of sodium hypobromait were injected in L1, L2 and L3, respectively in to a carrier stream of distilled water with flow rate 5.5 ml.min-1 as shown in scheme (1). The chemical parameters such as concentration of reagent used for oxidization & condensation reaction and the physical condition such as sample and reagents volumes), flow rate, reaction coil length, temperature and injection time that effect on the response of the reaction were studied and optimized. Analytical Analytical CHEMISTRY Analytical Analytical CHEMISTRY An Indian Journal
ACAIJ, 16(7) 2016 Bushra B.Qassim 313 Full Paper Full Paper TABLE 4 : Influence of variation of flow rate of carrier Confidence interval of the mean Average peak height (n=3) Pump speed indication approximate Flow rate (mL/min) (Carrier) n-1 %RSD x t n 1 mV . 0 05 n 5.5 1.1 269 2.30 1.40 269±0.58 6.0 2.0 291 0.00 0.00 291±0.96 6.5 2.9 323 1.06 0.32 323±0.81 7.0 4.5 328 0.23 0.07 328±0.18 7.5 5.5 364 1.10 0.38 364±0.00 8.0 6.3 163 0.61 0.23 163±3.50 TABLE 5 : Effect of reaction coil length Confidence interval of the mean Average peak n-1 Reaction coil length in cm %RSD x t n 1 height (n=3) mV . 0 05 n 50 364 1.22 0.34 364±3.10 100 160 0.00 0.00 160±0.00 150 140 1.00 0.71 140±2.50 200 130 0.00 0.00 130±0.00 TABLE 6 : Influence of temperature on response expressed as peak height (mV) Confidence interval of the mean Temperature Average peak height (n=3) n-1 %RSD C0 x t n 1 mV . 0 05 n 0 164 1.00 0.61 164±2.50 5 252 0.71 0.28 252±0.71 25 121 0.0. 0.00 121±0.00 45 117 2.00 1.71 117±5.10 Chemical variables Effect of á-naphthol concentration The effect of different concentrations of á-naphthol which soluble in ethanol 99% (1x10⁻⁴-1.5x10⁻³M) was studied, the concentration (1.2x10⁻³M) of á-naphthol was chosen to gave the optimum response which represented by peak height in mv. This concentration was chosen for subsequent experimental, the results obtained as shown in Figure 7 and tabulated in TABLE 1. Analytical Analytical CHEMISTRY Analytical Analytical CHEMISTRY An Indian Journal
Determination of L – arginine in human urine and blood serum . 314 ACAIJ, 16(7) 2016 Full Paper Full Paper Figure 12 : Influence of reaction coil length in (cm) Figure 14 : Effect of temperature Figure 15 : Effect of variation of purge time on response profile Figure 13 : Effect of volumes variation of injection sample & reagents TABLE 7a : Summary of calibration graph results for the determination of L – arginine by FIA method r, ttab. Measured Linear range of L- arginine for n=3 tcal= L-arginine (µg.ml-1) at confidence interval 95% r2, L-arginine (µg.ml-1) (µg.ml-1) at 95%, n-2 r2% 0.9979 0.243±0.0342+0.025±0.00136[arg.] µg.ml- 1 1-2000 3-1400 2.770 ?? 4.684 0.9958 99.58 Analysis of variance was carried out as shown in table (ANOVA) which indicated that there for , it can be concluded that there is an important relationship between the concentration of arginine and the response obtained. = = 4.667 ÂÂ Fstat. = 826.920 TABLE 7b : ANOVA for linear equation results[26-28] 2/S2 2 Source Sum of squares Df Mean square Fstat. = S1 Regression V 1 = 1 719994.7067 = 719994.7067 826.920 Error V2 = 13 870.694 = 11319.0266 Total 731313.733 14 Analytical Analytical CHEMISTRY Analytical Analytical CHEMISTRY An Indian Journal
ACAIJ, 16(7) 2016 Bushra B.Qassim 315 Full Paper Full Paper TABLE 8 : Limit of detection of arginine at optimum parameters Based on the value of slope Linear equation Limit of quantification Gradual dilution for the minimum concentration in calibration graph (mV) = yB+ 3SB (mV)=yB+10SB X= 1 µg 0.12 µg 253.39µg 382µg 5.7x10⁻⁶M 6.9x10⁻⁴M 1.43x10⁻³M 2.19x10⁻³M YB = average response for the blank solution (equivalent to intercept in straight line equation , SB= standard deviation of blank solution , x = value of L.O.D. based on slope TABLE 9 : Repeatability of L-arginine results Confidence interval of the mean Peak height [Arg.] Number of Standard Repeatability µg.ml-1 measuring (n) Deviation R.S.D % i(n=10) (mV) i ± t0.05, 60 10 175 1.05 0.60 175 ± 0.746 800 10 500 2.16 0.43 500 ± 1.545 decrease in peak height as shown in Figure 9 while at higher concentration, which led increase in peak height, 2.5M was chosen as the best sensitivity and repeatability,as shown in TABLE 3. Effect of urea concentration The effect of various concentration of urea was performed and 1.67M was chosen to be the optimum concentration to gave excellent response as shown in Figure 10. Urea added to remove the excess of sodium hypobromite and to increase the time of stability of the colored complex formed. Physical variables Effect of flow rate The effect of flow rate of distilled water as carrier of sample and reagents in the range (1.1-6.3ml.min-1) was investigated using optimum concentration of reactants. The results obtained tabulated in TABLE 4, a 5.5 ml.min-1 was chosen to be the optimum flow rate of the carrier as shown in Figure 11. Effect of reaction coil length A reaction coil length was an important parameter because it effect directly on the response of the reaction. The influence of the length of the reaction coil was Figure 16 : Linear calibration graph for L-Arginine concentration in µg.ml-1 Effect of sodium hypobromite concentration A series of solution ((0.1-1.6M) were prepared, each measurement was repeated for three successive times. It can be seen that sodium hypobromite so effect on the response figure (8a,b) shows that increase in the response intensity with increasing sodium hypobromite concentration. For this reason 0.25M was regarded as the best concentration for further work. Effect of sodium hydroxide concentration A set of experiment were carrying for chosen the optimum concentration of sodium hydroxide. It was observed that in low concentration, which leads Analytical Analytical CHEMISTRY Analytical Analytical CHEMISTRY An Indian Journal
Determination of L – arginine in human urine and blood serum . 316 ACAIJ, 16(7) 2016 Full Paper Full Paper Figure 17 : Response of repeatability measurements of L-arginine concentration using CFIA method 10, 15, 20, 25, 30, 35) sec were used in this study in addition to allowed the injection valve in the open mode via the carrier stream was studied, as shows in figure (15). Open time more than 35 sec was chosen as optimum purge time to complete purge of the sample loop to flow cell. Analytical parameters Under the optimum parameters above, calibration graph of L-arginine was constructed by plotting average peak height (n=3) in mV as a function of the analyte concentration. Linear calibration graph for the individual determination in the range of 3 – 1400 µg.ml-1 for L- arginine. The obtained results were tabulated in TABLE (7(a), (b)) while their clarification was in Figure 16 which shows the different of response with concentration of L-arginine. The FIA – merging zones is most suitable cause of its sample through put of 45 sample / hour, have a good recovery and wider linear range of calibration curve. Detection limit Detection limit for arginine was conducted using three different approach as tabulated in TABLE 8. Repeatability study Ten successive injection samples measurements evaluated in the range (50 – 200 cm) with 2 mm internal diameter. A 50cm was chosen to be the optimum reaction coil length which gave highest peak with low dispersion level as shown in Figure 12. The results obtained was clarified it in TABLE 5 Effect of injection sample and reagent volumes The injection volumes of sample and reagent were studied by using different lengths of loops and using open valve mode with 0.7 mm internal diameter of loops, the results obtained clarified that injection volumes of sample (arginine with few drops of sodium hydroxide), reagents (á-naphthol with urea) and sodium hypobromite was (42.19, 43.8, 54.95) µl, respectively, gave the highest response as shown in Figure 13. Effect of temperature The effect of temperature on the color intensity of the product was examined as shown in TABLE 6. Partically, a maximum absorbance was obtained when the color develop at 5 0 C in ice bath with stability of the product at least 1 hour as shown in Figure 14. Effect of Purge Time The effect of purge time on the response and it is sensitivity was followed using the optimum physical and chemical parameters achieved in previous sections. (5, Analytical Analytical CHEMISTRY Analytical Analytical CHEMISTRY An Indian Journal
ACAIJ, 16(7) 2016 Bushra B.Qassim 317 Full Paper Full Paper TABLE 10 : Paired t-test for FIA method with quoted value using standard additions method for the determination of L- arginine in blood and urine samples Practical content Paired t- test Official method Rec% ttab .at 95% confidence interval n-1 Sample no. Kind of sample n-1 D Rec% d Quoted value New method n d / n-1 40 39.89 0.11 99.725 1 Blood 0.123 0.121 1.73 < 4.303 40 39.75 0.25 99.375 40 39.99 0.01 99.975 100.2 80 79.99 0.01 99.988 7.07x10- 3 2 Blood 80 79.98 0.02 0.01 99.975 2.40 < 4.303 80 80 0 100 20 19.78 0.22 98.9 20 19.99 0.01 3 Urine 0.077 0.110 99.95 1.19 < 4.303 20 20 0 100 99.99 60 59.89 0.11 99.82 1.87 < 4.303 4 Urine 60 59.99 0.01 0.11 0.1 99.98 60 59.79 0.21 99.65 *Average of Six determinations were carried out for repeatability study for the determination of arginine by measurements of the colored formed by Sakaguchi reaction of L-arginine at concentration 60, 800 µg.ml-1 in the presence of sodium hypobromite as an oxidizing agent. TABLE 9 show the results obtained, while figure (17a&b) indicated the response profile. Analytical application The developed method was applied for determination of arginine in blood and urine samples taking from four different people take the drug of arginine as strainer. It was compared with official method, TABLE 10 shows the results at confidence interval 95%, paired t-test was also used. The obtained results indication clearly that there was no significant difference between the new FIA method with official method[29] at 95%, confidence interval as the calculated t-test value is less than tabulated t-test value. CONCLUSION The suggested method flow injection analysis is rapid, simple, sensitive & inexpensive for the determination of arginine in biological samples (blood & urine). The method is based on the reaction oxidation of á- naphthol and condensation with arginine in basic medium (sodium hydroxide) using sodium hypobromite as oxidizing agent and urea as stabilized agent of colored product with able to determine the samples (through put of 52 sample/h). The RSD% 2 and good agreement were observed for all samples, which is an indication of satisfactory accuracy and precision of the suggested method. The suggested method uses cheaper reagents and instruments. The standard additions method was used to avoid matrix effects. Analytical Analytical CHEMISTRY Analytical Analytical CHEMISTRY An Indian Journal
Determination of L – arginine in human urine and blood serum . 318 ACAIJ, 16(7) 2016 Full Paper Full Paper REFERENCES by reverse phase high – performance liquid chromatography : Precolumn derivatisation with phenyl isothiocyanate, Anal. Biochem., 136, 65-74 (1984). [18] F.Mendel; Applications of the Ninhydrin Reaction for Analysis of Amino Acids, Peptides and Proteins to Agricultural and Biomedical sciences, J.Agric. Food Chem., 52(3), 385-406 (2004). [19] H.J.Bremer, M.Duran, H.Przyrembel, S.K.Wadman; Chemical methods for detection, quantitation and identification of amino acids in body fluids, In: H.J.Bremer, M.Duran, J.P.Kamerlling, H.Przyrembel, S..K.Wadman, (Eds.), Distur bances of hal – 00306557, Version, 1-28 Jul-35 (2008). [20] M.Brad ford; A rapid and sensitive method for the quantitation of microgram quantities of protein utilizing the principle of protein – dye binding. Anal. Biochem., 72, 248-54 (1976). [21] R.L.Heinrikson, K.J.Kramer; Recent advances in the chemical modification and covalent structural analysis of proteins. In: E.T.Kaiser, F.J.Kezdy, (Eds.), Progress in Bioorganic chemistry, Wiley – Inter science, 3, 141-149 (1974). [22] D.Kowalczuk, Spectrophotometric analysis of cefepime and L – arginine in the pharmaceutical preparation. Annales universitatismariae curie – Sklodowska Lublin – Polonia SECTIO DDD, N2, 20, 11 (2007). [23] www.safcbiosciences.com. Technical Bulletin, Protein Purification Techniques; Ipnic precipitation, 1. [24] Arvydas Kaminskas, Asta Mazeikiene; Vilnius. BioChemistry Laboratory Manual, Vilniusity University faculty of Medicine, (2012). [25] C.J.Weber; A modification of Sakaguchi reaction for the quantitative determination of arginine, J. Biol. Chem., 86, 217-222 (1930). [26] J.Murdoeh, J.A.Barnes; Statistical tables. 2nd Edition, Macmillan, 8 (1974). [27] J.C.Miler, J.N.Miller; Statistics for analytical chemistry. 6 nd Edition, John Wiley & N.y. Sons, (2010). [28] A.G.Bluman; Elementary Statistics. 3rdEdition, WCB/MC Graw-Hill, New York, (1997). [29] European pharmacopeia 5.0, Council of European (COE), European Directorate for the quality of medicines (EDQM), Arginine hydrochloride, 0805 (2007). [1] H.Brückner, A.Schieber; Determination of amino acid enantiomers in human urine and blood serum by gas chromatography / MS, Biomed. Chromatogr., 15, 166–172 (2001). [2] C.M.Stoscheck; Quantitation of protein, Methods in Enzymology, 182, 50–69 (1990). [3] D.A.Bender; Amino Acid Metabolism., Wileyi chichester, (1985). [4] A.W.Deckel; Dietary arginine alters time of symptom onest in Huntington’s disease transgenic mice, Brain Research volume ISS: 1-2, 187–195 (2000). [5] J.W.Dubnoff, H.Borsook; Organic Anion Binding by Denatured Bovine Serum Albumin, J.Biol. Chem., 138, 381 (1941). [6] E.A.H.Sims; Urinary Excretion of Creatine and Creatinine in Dermatomyositis, J.Biol.Chem., 158, 239 (1945). [7] A.Hunter, Daupkinee; J.Biol.Chem., 85, 627 (1946). [8] J.W.Dubnoff; J.Biol.Chem., 141, 711 (1941). [9] H.D.Hoberman; The guanidoacetic acid and arginine in human urine and serum., from the Department of Internal Medicine, Yala Univ. School of Medicine, New Haven, 721- 727 (1946). [10] C.J.Gómez, A.D.Marenzi; Pubs. Inst. Invest. Microquim. Univ. nacl. Litoral (Rosario, Arg.), Cited by Chem. Abstr., 48, 11523f, 17, 94 (1953). [11] F.J.I.Al- Shammaa, M.A.A.Al- Byati, S.J.Ajeena; Modification of spectroscopic method for Determination of L – arginine in Different Tissue extracts, Pak. J.Chem., 2(1), 1-5 (2012). [12] Urban, Schwarzenberg; Amino acid metabolism : Clinical Chemistry and diagnosis, Germany, 421- 42 (1981). [13] R.Mira de Orduna; Quantitative determination of L – arginine by enzymatic end – point analysis, J. Agric. Food Chem., 49, 549-552 (2001). [14] S.S.Spireas, C.I.Jarowski, B.D.Rohera; Powdered solution technology : Principles and mechanism, pharmaceut. Res., 9(10), 1351–1358 (1992). [15] K.McDonald, S.Zharikov, M.A.Block Eand Kiberg; Caveolar complex between the cationic amino acid transporter 1 and eudothelial nitric – oxide synthase may explain the arginine paradox, J. Biol.Chem., 272, 31213–31216 (1997). [16] C.M.Stoscheck; Quantitation of protein, methods in enzymology, 182, 50-69 (1990). [17] R.L.Heinrikson, S.C.Meredith; Amino acid analysis J.P.Kamerling, determination of R.Pietras, J.Baran; Analytical Analytical CHEMISTRY Analytical Analytical CHEMISTRY An Indian Journal