Download
1 / 5
50 likes | 59 Views
Occupational data. Paul Lambert, University of Stirling Presentation to the Scottish Civil Society Data Partnership Project (S-CSDP), Webinar 3 on ‘Dealing with data: Using standard measures and variables and linking together datasets’ www.thinkdata.org.uk , 10 Mar 2016.

E N D
Occupational data Paul Lambert, University of Stirling Presentation to the Scottish Civil Society Data Partnership Project (S-CSDP), Webinar 3 on ‘Dealing with data: Using standard measures and variables and linking together datasets’ www.thinkdata.org.uk, 10 Mar 2016
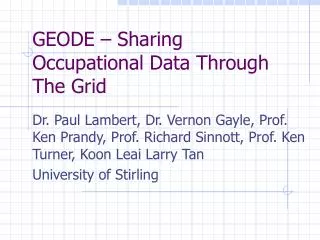
Occupational data is great… • Abundant • Often recorded in relatively fine-grained detail • Often recorded for significant other people • Valuable information about people, esp. on their enduring social position • Sayer, A. (2011). Habitus, Work and Contributive Justice. Sociology, 45(1), 7-21. • Jonsson, J. O., Grusky, D. B., Di Carlo, M., Pollak, R., & Brinton, M. C. (2009). Microclass Mobility: Social Reproduction in Four Countries. American Journal of Sociology, 114(4), 977-1036. • Kurtz, T. (2009). Social Inequality and the Sociology of Work and Occupations. International Review of Sociology, 19(3), 387-399. S-CSDP, 10 Mar 2016
Some FAQ’s linked to occupations Q: What’s the best way to measure social class? A: Methodologists favour standardised occupation-based measures such as the NS-SEC class scheme based on SOC2010. Q: That sounds hard; can’t I use something else? A: All sorts of things are sometimes used to measure class, e.g. education, tenure, asset ownership, area profile. It is best if you can justify, and clearly document, whatever non-standard measure you choose. Q: What’s the best measure if my target group is mostly old or young? A: For older: occupation, tenure, assets. For younger: Education, occupation, consumption. For nobody: Area profile. Q: It still sounds hard to use occupations? A: It’s a little easier than it seems: Use a standard tool to code to an occupation unit group (e.g. http://www2.warwick.ac.uk/fac/soc/ier/software/cascot), then a standard translation code to go from occupations to the measure (e.g.http://www.camsis.stir.ac.uk/occunits/distribution.html). Q: What should be done for people who don’t have occupations? A: Methodologists suggest the best approach is: (i) allocate by the occupation of the ‘dominant’ economic position in the household; (ii) use the most recent job if there isn’t a current job; (iii) use the occupation of a significant alter, such as spouse or parent Q: Aren’t there more important socio-economic measures than occupation-based ones? A: Probably not ;-) But there are lots of other interesting socio-economic concepts and measures. There are recommendations and methodological literatures on things such as the best way to measure and analyse income, wealth, housing situation, consumption, poverty, human capital, social capital and regional economic profile (e.g. Bulmer et al. 2010; Shaw et al. 2007: ONS 2012) S-CSDP, 10 Mar 2016
…Using occupational data… • The data linkage stage (e.g. www.dames.org.uk/workshops) • The coding stage …is linked to microdata from elsewhere, giving new variable(s) based upon occupation match files file=* /table=“index.sav” /by=soc2010 es . Occ. ‘index file’ from www.camsis.stir.ac.uk S-CSDP, 10 Mar 2016
Summary on occupational data… • Processing occupational data is typically done through research software, but can be done ‘on the fly’ • Usually code both ‘occupational title’ and ‘employment status’ • ‘Standard’ measures exist for occupations, including approaches for making comparisons over time/countries References cited • Bulmer, M., Gibbs, J., & Hyman, L. (Eds.). (2010). Social Measurement through Social Surveys: An Applied Approach. Aldershot: Ashgate. • Lambert, P. S., & Bihagen, E. (2014). Using occupation-based social classifications. Work, Employment and Society, 28(3), 481-494 (DOI: 410.1177/0950017013519845). • ONS. (2012). Office for National Statistics, Guidance and Methodology: Harmonisation Programme. Retrieved 1 May, 2012, from http://www.ons.gov.uk/ons/guide-method/harmonisation/harmonisation-programme/ • Shaw, M., Galobardes, B., Lawlor, D. A., Lynch, J., Wheeler, B., & Davey Smith, G. (2007). The Handbook of Inequality and Socioeconomic Position: Concepts and Measures. Bristol: Policy Press. • Long, J. S. (2009). The Workflow of Data Analysis Using Stata. Boca Raton: CRC Press. S-CSDP, 10 Mar 2016