Download
1 / 15
150 likes | 336 Views
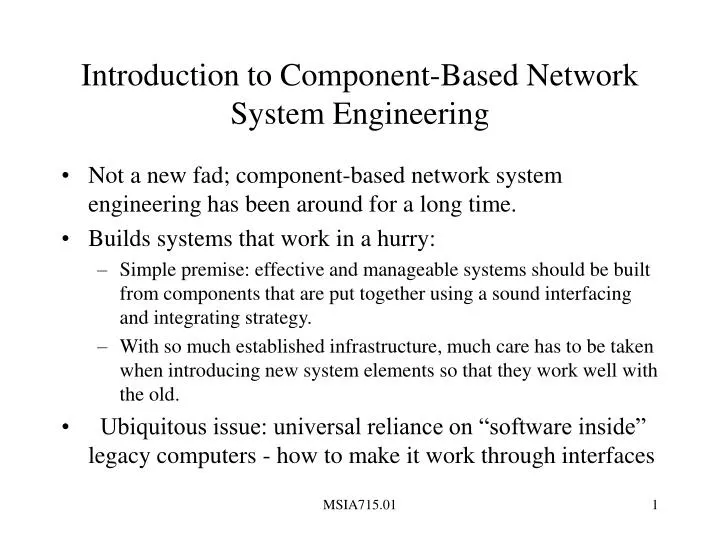
Introduction to Component-Based Network System Engineering. Not a new fad; component-based network system engineering has been around for a long time. Builds systems that work in a hurry:

E N D
Introduction to Component-Based Network System Engineering • Not a new fad; component-based network system engineering has been around for a long time. • Builds systems that work in a hurry: • Simple premise: effective and manageable systems should be built from components that are put together using a sound interfacing and integrating strategy. • With so much established infrastructure, much care has to be taken when introducing new system elements so that they work well with the old. • Ubiquitous issue: universal reliance on “software inside” legacy computers - how to make it work through interfaces MSIA715.01
Interfaces • Defined: • “An interface arises whenever two or more distinct entities or components need to communicate in some way. An element of software that either passively (the data passes through the interface unchanged) or actively (where the data is transformed) enables one system to exchange information with another. • Types: • Human to computer, database system • Protocol, interactive speech. • Why interfaces matter: • natural and computer language translations possible. • Interfaces enable integration among multiple components. MSIA715.01
Towards the Real World • Ideal end-state: “Plug and Play” • Software, hardware, and techniques used by humans to use them are all standardized, in the perfect world. • Integration is problematic and expensive • The real world • More than one interface unit is required because the process of interfacing two large systems is complex. • After making data flow freely between the large systems, problems of multiple updates and additional processing power required to operate the interfaces arise. • The interface equation is a precise tool to solve integration problems. MSIA715.01
TRAFFIC ENGINEERING • Introduction: • Traffic engineering is the mathematical modeling of demand on a telecommunications network, and the number of lines needed to meet those needs. It is the calculation of random number of arrival events taking place over a specified period of time. In the telecommunications arena, this is the number of possible first attempts to get an outside line, or possible times for an incoming line to ring into an organization on the first try. • Basic TE calculation: the length of time allocated to a random call attempt is one second. The number of seconds in a minute is 60; the number of minutes in an hour is 60. Therefore, the maximum number of random call attempts possible in an hour is 3,600. MSIA715.01
Introduction to Traffic Engineering, cont’d • The telecommunication network receives and processes calls to and from access lines, but the number of access lines is fixed. As a result, the number of access lines available to the network must be capable of handling the heaviest loads, with the expectation that a portion of the access lines will be idle during all other times. To calculate the busiest time, the manager conducts a traffic study to determine the hour during the day when the most calls are processed. However, if the busy hour is significantly higher in terms of demand than non-busy hours, the network will be less efficient because the access lines represent a fixed cost. On the other hand, if the busy hour is not accommodated, service will not always be available to users when they request it. • TE Issues: • What level of service is needed by the organization? • What is the organization willing to pay? MSIA715.01
TRAFFIC ENGINEERING INPUT • Traffic analysis data comes from: • (1) INWATS bills, but these only show completed calls, and not calls that received busy signals. • (2) Telephone bills for outgoing calls, but these depend on the quality of the telephone bills. • (3) Best source: PBX-generated calling and called information. Most modern PBXs allow users to program the switch to produce custom usage reports. • (4) Specialized call usage data purchased from the telephone company (busy study and peg count). MSIA715.01
Gathering Call Information Data • Let there be: • 1. 500 total hours of billed usage in a month • 2. The average call is four minutes • 3. The average unbilled call overhead is 30 seconds • 4. The number of business days in the month is 22 • 5. The average business day is 8 hours long MSIA715.01
THE BASICS • 6. The average hourly distribution of calls is as follows: (Table 8.3) • Calculation 1: (Total hours =500) (60 minutes in an hour) = • 4 minutes per call • 30,000 = 7,500 billed calls/month • 4 • Calculation 2: 7,500 x 30 seconds/60 seconds = 62.5overhead hours • 60 minutes MSIA715.01
THE BASICS, cont’d • Calculation 3: 500 hours of total billed usage • +62.5 overhead hours • 562.5 hours of billed and unbilled access lines • - Convert the data to daily or hourly usage (based upon usage studies) • - Choose the appropriate tool (usually provided by the equipment and service vendors) MSIA715.01
Poisson Distribution:The Simplest and Most Widely Used • 1. Begin with the maximum number of calls per hour (3,600). The PD takes into account all 3,600 possible arrival rates and calculates these on the number or circuits necessary to suport this traffic load. • 2. The Centum, or calls per hundred seconds (CCS ) is calculated by dividing 3,600 by 100, to arrive at 36 CCS per hour. Once the traffic load is converted to CCS, the model will determine the number of CCS that can be carried within a specific design. MSIA715.01
Poisson Distribution:The Simplest and Most Widely Used • 3. Calculations: • - Total billed and unbilled traffic hours/month = 562.5 • - 562.5_________ = 25.57 daily hours • 22 bus days/month • - 25.57 times the percent of daily traffic carried during the busy hour (17%) = 4.3469 equivalent busy hours traffic • - 4.3469 times 36 CCS = 156.48 CCS MSIA715.01
Poisson Distribution:The Simplest and Most Widely Used • - Grade of service desired: P.05, or 5% of callers will probably experience a busy tone. • - From PD table on page 155 (8.4), pick the number of circuits needed on the basis of the intersection between P.05 and the next higher number of CCS. (9 access lines) • Note: Table 8.5, sensitivity of data using different service grades. MSIA715.01
Erlang Distribution • Assumption used is that if a caller encounters a denial or busy tone when attempting to place a call, the caller will ber routed to a more expensive circuit (such as the long-distance netowkr called DDD) or will give up trying to make the call. ED has no queuing, so it is rarely used. Erlang B is more popular for that reason. See permutations of Erlang models at table 8.6 (p. 157). • 1. Erlangs = Number of calls handled in the busy hour times avg call length in seconds, divided by 3,600: • 4.3469 times (60 minutes times 60 seconds) = 15648.84 • 15648.84/3600 = 4.35 Erlangs • 2. Using the Table 8.7, eight access lines are needed for the P.05 service grade. MSIA715.01
QoS Impact on Traffic Engineering • Great arithmetic drill, but what does it all mean? • Put another way, moving from a P05 to a P01, what is the effect on: • Ports required on the automatic call distribution system • Agents required to service the calls • Terminal devices required for the agent answering positions • Floor space and desk space required for the agent to conduct business • Benefits associated with hiring agents (increased sales) • Payroll costs associated with each agent • Personal computers or mainframe terminal devices required for customer lookup and inquiry • Wiring required • Cost/benefit analysis: Benefit/cost ratio; most companies base decisions on a 3:1 ratio. Some are higher. GI/GO applies. MSIA715.01
Homework Assignment • Let there be: • 1. 800 total hours of billed usage in a month • 2. The average call is five minutes • 3. The average unbilled call overhead is 30 seconds • 4. The number of business days in the month is 22 • 5. The average business day is 8 hours long • 6. The busy hour is 17% of the daily average calls • What is the total number of circuits for Poisson Distribution? Erlang? MSIA715.01