Download

1 / 12
120 likes | 212 Views
Introduction to the Use of Classic Quality Tools. Presented by Dr. Joan Burtner Certified Quality Engineer Associate Professor of Industrial Engineering and Industrial Management. Seven Classic Problem-Solving Tools of Quality. Flowchart Check Sheet Cause-and-Effect Diagram Pareto Chart

E N D
Introduction to the Use of Classic Quality Tools Presented by Dr. Joan Burtner Certified Quality Engineer Associate Professor of Industrial Engineering and Industrial Management
Seven Classic Problem-Solving Tools of Quality • Flowchart • Check Sheet • Cause-and-Effect Diagram • Pareto Chart • Control Chart • Histogram • Scatter Diagram Dr. Joan Burtner, Associate Professor of Industrial Engineering
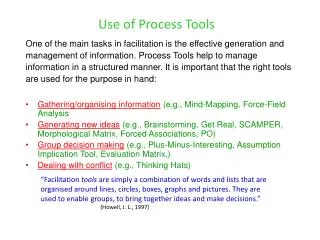
Classic Quality Tool 1:Flowchart • Maps the sequence of steps and decision points in a process • Helps group to have common understanding of the process Dr. Joan Burtner, Associate Professor of Industrial Engineering
Classic Quality Tool 2:Check Sheet • Also known as a tally sheet • Helps gather data on the frequency of occurrence of particular events or defects • Check sheet design often requires prior knowledge of the process Dr. Joan Burtner, Associate Professor of Industrial Engineering
Classic Quality Tool 3:Cause-and-Effect Diagram • Other names • Fishbone diagram • Ishikawa diagram • C-E diagram • Used to show the many different causes that may contribute to a problem (effect) • Causes are frequently generated through brainstorming sessions Dr. Joan Burtner, Associate Professor of Industrial Engineering
Classic Quality Tool 3:C-E Diagram • Manufacturing Environment 4M Chart • Man • Machine • Methods • Materials • Service Environment 4P Chart • People • Policies • Procedures • Plant Dr. Joan Burtner, Associate Professor of Industrial Engineering
Classic Quality Tool 4:Pareto Chart • Pareto (an 1800s Italian economist) noted that 80 percent of the wealth in Italy was held by 20 percent of the population • Juran (20th century) 80% of the variation in a process is caused by 20% of the variables • 20% - vital few • 80% - trivial many or useful many Dr. Joan Burtner, Associate Professor of Industrial Engineering
Classic Quality Tool 4:Pareto Chart • Causes are frequently documented in a check list which is used to generate a Pareto chart • Managers use Pareto charts to help focus or prioritize process improvement efforts Dr. Joan Burtner, Associate Professor of Industrial Engineering
Classic Quality Tool 5:Control Chart • Purpose • Indicates how a process behaves over time • Shows when a process is being influenced by special causes • Chart consists of UCL, CL, LCL, and data points • Examined for nonrandom patterns Dr. Joan Burtner, Associate Professor of Industrial Engineering
Classic Quality Tool 6:Histogram • Bar graph that represents the frequency distribution of the data • X-axis shows cell boundaries • Y-axis shows cell frequency • Shape of the bars is only a rough indication of the distribution Dr. Joan Burtner, Associate Professor of Industrial Engineering
Classic Quality Tool 7:Scatter Diagram • Also known as an X-Y graph • “Shows whether or not there is a correlation between two variables” • Caution: A statistical correlation does not guarantee a direct cause and effect • Linear/nonlinear • Positive/negative Dr. Joan Burtner, Associate Professor of Industrial Engineering
Contact Information • Email: Burtner_J@Mercer.edu • US Mail: Mercer University School of Engineering 1400 Coleman Avenue Macon, GA • Phone: (478) 301- 4127 Dr. Joan Burtner, Associate Professor of Industrial Engineering