Download
1 / 1
10 likes | 149 Views
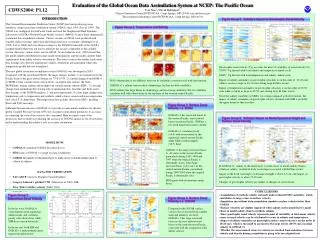
Evaluation of the Global Ocean Data Assimilation System at NCEP: The Pacific Ocean Yan Xue 1 , David Behringer 2 1 Climate Prediction Center/NCEP/NOAA, Camp Springs, MD 20746, yan.xue@noaa.gov 2 Environmental Modeling Center/NCEP/NOAA, Camp Springs, MD 20746. CDWS2004: P1.12. INTRODUCTION

E N D
Evaluation of the Global Ocean Data Assimilation System at NCEP: The Pacific Ocean Yan Xue1, David Behringer2 1Climate Prediction Center/NCEP/NOAA, Camp Springs, MD 20746, yan.xue@noaa.gov 2Environmental Modeling Center/NCEP/NOAA, Camp Springs, MD 20746 CDWS2004: P1.12 INTRODUCTION The National Environmental Prediction Center (NCEP) has been producing ocean reanalysis using ocean data assimilation system (ODAS) since 1995 (Ji et al. 1995). The ODAS was configured for the Pacific basin and used the Geophysical Fluid Dynamics Laboratory’s (GFDL) Modular Ocean Model version 1 (MOM.v1) and a three-dimensional variational data assimilation scheme. Various versions of ODAS were produced with variable surface forcings, input data and background error covariances (Behringer et al. 1998; Ji et al. 2000) and were shown to improve the ENSO forecast skill of the NCEP’s coupled model when they are used to initialize the oceanic component of the coupled system. However, serious errors exist in ODAS. Acreo-Schertzer et al. (1997) found that the model salinity distribution becomes nearly homogeneous and the model currents differ significantly from drifter velocity observations. The main reason is that neither fresh water flux forcings nor observed temperature-salinity correlations are maintained when only temperature profile data are assimilated. The new global ocean data assimilation system (GODAS) was developed in 2003. Compared with the operational ODAS, the major changes include 1) an extension from the Pacific basin to the quasi-global domain for 75OS-65ON, 2) a model change from MOM.v1 to MOM.v3 that contains more vertical levels, an explicit free surface, the Gent-McWilliams mixing scheme and an improved vertical mixing scheme (KPP), 3) a forcing change from momentum flux forcing only to momentum flux, heat flux and fresh water flux forcings of the NCEP Reanalysis 2, and most importantly, 4) a data input change from temperature only to temperature and synthetic salinity that is constructed from temperature and a local T-S climatology. The temperature data includes those from XBTs, profiling floats and TAO moorings. Although the main mission of GODAS is to provide oceanic initial conditions for the new global Coupled Forecast System (CFS) for seasonal to interannual prediction, its accuracy in estimating the state of the ocean is also concerned. Here we report some of the progresses that we made in evaluating the accuracy of GODAS against in situ observations and in understanding the salinity’s role on oceanic circulations. Figure Group 5: Salinity’s Impact on Geostrophic Zonal Velocity Figure Group 2: Temperature and Salinity Geostrophic zonal velocity (Ug) accounts for most of variability of zonal velocity (U). TANU: Ug derived with total salinity and temperature annual cycle. SANU: Ug derived with total temperature and salinity annual cycle. Impact of salinity anomalies on geostrophic velocities is on the order of 10-20 cm/s while it can be as large as 40-50 cm/s during large El Nino events. Impact of temperature anomalies on geostrophic velocities is on the order of 20-30 cm/s while it can be as large as 40-50 cm/s during large El Nino events. Since the salinity variability in SIM is too strong compared with observations, the impact of salinity anomalies on geostrophic velocity obtained with SIM is probably the upper bound of that in reality. SIM’s thermocline is too diffused, however its variability correlates well with observations. GODAS.v1’s salinity has a realistic climatology, but has too little variability. SIM’s salinity has large biases in climatology, and too strong variability. But its variability correlates well with observations in the top layer of the western-central Pacific. Figure Group 3: Surface Zonal Velocity v.s. Drifter GODAS.v1 has westward biases in the western Pacific and eastward biases in eastern Pacific. SIM has a too weak equatorial counter current. Figure Group 6: Salinity’s Impact on Model Dynamical Height and Surface Zonal Velocity • MODEL RUNS • GODAS.v1 (standard GODAS described above) • SIM (same as GODAS.v1 except no data assimilation) • GODAS.v2 (salinity in the mixed layer is made closer to model salinity than to sythetical salinity) GODAS.v1 correlates poorly (<0.4) with observations in the equatorial central-eastern Pacific, while SIM correlates highly (>0.7) there. GODAS.v1 has large westward biases (> -60 cm/s) in the western Pacific, particularly during 1992-1994 and 1997 when the tropical Pacific is abnormally warm. It has large eastward biases (> 45 cm/s) in the central-eastern Pacific, particularly during 1999-2001 when the tropical Pacific is abnormally cold. SIM agrees with observations much better. • DATA FOR VERIFICATION • TAO ADCP (Acoustic Doppler Current Profilers) • Gregory Johnson’s gridded CTD (Johnson et al. 2000, JGR) • Peter Niiler’s drifter velocity (Niiler 2001) • OSCAR (ocean surface current analyses – real time, Bonjean and Lagerloef 2002, JPO) In GODAS.v2, salinity in the mixed layer is made closer to model salinity than to sythetical salinity, resulted in fresh warter input associated with El Nino events. Impact of the fresh water input on dynamical height is about 2-3 cm, and impact on geostrophic velocity is about 15-20 cm/s. Changes of geostrophic velocity are similar to changes of total velocity. coustic • CONCLUSIONS • Assimilation of synthetic salinity seriously underestimated SSS variability, which contributes to large errors in surface velocity. • Simulation run without data assimilation simulates surface velocity better than GODAS. • Surface velocities are slightly improved when salinity in the mixed layer is made closer to model salinity than to synthetic salinity. • Since geostrophic zonal velocity represents most of variability of total zonal velocity, errors in zonal velocity can be attributed to errors in salinity and temperature. • Impact of salinity anomalies on geostrophic surface zonal velocity is on the order of 10-20 cm/s, which is too small to account for the large errors (40-70 cm/s) in zonal velocity in GODAS.v1. • Whether the unaccounted errors in velocity are resulted from unbalance between velocity and density during assimilation is going to be investigated next. Figure Group 1: Subsurface Zonal Velocity Figure Group 4: Surface Zonal Velocity v.s. OSCAR In the far west, GODAS.v1 overestimates mean equatorial undercurrent, and correlates poorly with observation, while SIM does a much better job. Compared with OSCAR surface velocity that is derived from satellite wind and altimetry sea level, GODAS,v1 has large westward biases in the west and eastward biases in the central-eastern Pacific, consistent with the comparison with drifter velocity. In the far east, both SIM and GODAS.v1 underestimate mean equatorial undercurrent.