Download
1 / 16
170 likes | 299 Views
Developments in Seismic Imaging of the MC118 from 2D, 3D and 4D data. Antonello Simonetti 1 , James H. Knapp 1 , Leonardo Macelloni 2 , Camelia C. Knapp 1 , Carol B. Lutken 2. 1. Department of Earth and Ocean Sciences, University of South Carolina

E N D
Developments in Seismic Imaging of the MC118 from 2D, 3D and 4D data Antonello Simonetti1, James H. Knapp1, Leonardo Macelloni2, Camelia C. Knapp1, Carol B. Lutken2 1. Department of Earth and Ocean Sciences, University of South Carolina 2. Mississippi Mineral Resources Institute and Center for Marine Resources and Environmental Technology, University of Mississippi Presented to the GoM-GHRC Annual Meeting – Oxford, MS – Oct 26-27 2010
SUMMARY TOPICS • WHERE WE WERE: - Integration and interpretation of TGS 3D data, SSDR 2D Hi-Res data and AUV-Chirp 2D data; - Pseudo 4D seismic analysis, some insights about the GHSZ of the MC118. • WHERE WE ARE: - Recent re-processing of SSDR High Resolution data and correction of the timing problem; - Western Geco 3D Oil-Ind data. • WHERE WE ARE HEADING: - Further interpretations on SSDR High Resolution data; - 4D seismic analysis using TGS and Western Geco data; - “Marine Hydrate stability and response to oceanographic variability: an integrated modeling and empirical approach” (NASA Proposal)
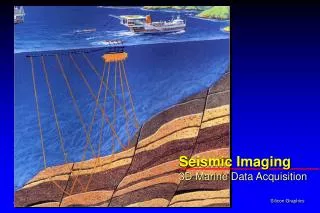
SEISMIC DATA INTEGRATION Seafloor Pockmarks and Craters are closely related to their underlying acoustic anomalies refered as free gas at the base of GHSZ. The anomalies occur at constant depth of 160 ms TWTT (~ 150 m b.s.f.) Seafloor Pockmarks and Craters are circular depression of the seafloor. Generally, they formed by the escape of fluids or gas into the water column and by violent episodic gas blowout, respectively. Time slice from TGS 3D volume Seafloor Pockmarks and Craters are located above the Master Faults which are most likely the main conduits for thermogenic HC.
GHSZ INFERRED FROM SEISMIC DATA - It exhibits heterogeneity in the subsurface of the Woolsey Mound. - BGHSZ observed ~150 m beneath the seafloor. - Shallow GH formation and accumulation appear to be concentrated near faults and fractures. - GHSZ shows transience on the scale of the years, basing on Pseudo 4D seismic analysis. - Trigger mechanisms of temporary gas hydrates dissociation still remain unclear. They might be a combination of multiple processes (tectonics, upwards stress-failure induced by arising HC, oceanographic variations, or any phenomena which lead to perturbations into the GH stability field).
SUMMARY TOPICS • WHERE WE WERE: - Integration and seismic interpretation of TGS 3D Oil-Ind data, SSDR 2D Hi-Res data and AUV-Chirp 2D data; - Pseudo 4D seismic analysis, some insights about the GHSZ of the MC118. • WHERE WE ARE: - Recent re-processing of SSDR High Resolution data and correction of the timing problem; - Western Geco 3D Oil-Ind data. • WHERE WE ARE HEADING: - Further interpretations on SSDR High Resolution data; - Real 4D seismic analysis using TGS and Western Geco data; - “Marine Hydrate stability and response to oceanographic variability: an integrated modeling and empirical approach” (NASA Proposal)
SSDR data re-processing and time correction SSDR data before the time correction Sample rate 10 μsec
SSDR data re-processing and time correction SSDR data after the time correction Sample rate 8 μsec
WesternGeco • 3D Industry Seismic Data • Acquired 2002 (May, Aug, Dec) • 10 sec TWTT • Volume extends 1 mi beyond MC118 • In-Line & Cross-Line spacing: 12.5 m
Record Length: 3 sec TWTT TGS vs WGeco Record Length: 10 sec TWTT
SUMMARY TOPICS • WHERE WE WERE: - Integration and seismic interpretation of TGS 3D Oil-Ind data, SSDR 2D Hi-Res data and AUV-Chirp 2D data; - Pseudo 4D seismic analysis, some insights about the GHSZ of the MC118. • WHERE WE ARE: - Recent re-processing of SSDR High Resolution data and correction of the timing problem; - Western Geco 3D Oil-Ind data. • WHERE WE ARE HEADING: - Further interpretations on SSDR High Resolution data; - Real 4D seismic analysis using TGS and Western Geco; - “Marine Hydrate stability and response to oceanographic variability: an integrated modeling and empirical approach” (NASA Proposal)
Further Interpretations on SSDR data GH accumulation? High-Frequency signal scattering near fault.
WesternGeco (2002) TGS (2000) 4D Seismic Analysis Detecting temporal changes in seismic anomalies through amplitude map, residual map etc
NASA Proposal • Potential influence of oceanographic events • on hydrate stability • Reconstruct GOM oceanography through • remote sensing and modeling • Compare with observations from past MC118 • cruises • Forecast future oceanographic events and • plan observations on future cruises
CONCLUSIONS - Woolsey Mound at MC118 hosts a very complex scenario for GH, where salt, thermogenic hydrocarbons, faults and fractures play a significant role for the hydrate/carbonate mound evolution. - Gas Hydrates formation, accumulation and dissociation are closely related to deep-seated faults which provide hydrocarbons through the sea floor and into the water column. - Pseudo 4D seismic analysis reveals a subsurface dynamic systems that seem to change in a short time frame (5 or 6 years). Therefore, they need regular detailed observations multiple surveys through the time. As we have no seismic records since 2006, our suggestion would be to collect a new seismic survey shortly. - A further analytical approach will be addressed to our site in order to understand whether or not the GHSF could be affected even by very short term (months or weeks) variations in oceanographic currents. - Quantitative estimation of GH saturation can be hardly argued without auxiliary constrains. Geophysical borehole logging into the GHSZ (i.e. resistivity log, density log and sonic log) would provide diagnostic information about the GHSF.
ACKNOWLEDGEMENTS • TGS Nopec • WesternGeco • SMT • Lookout Geophysical Company • MMRI & CMRET – University of Mississippi • Funds provided by DOI, MMS, DOE, NTEL, DOC, NOAA-NIUST