Download
1 / 49
530 likes | 660 Views
Chapter 11 Inflation and the Quantity Theory of Money. Introduction. Robert Mugabe, president of Zimbabwe had a problem. His policies pushed his country, once called the breadbasket of Africa, to the verge of starvation.

E N D
Chapter 11 Inflation and the Quantity Theory of Money
Introduction • Robert Mugabe, president of Zimbabwe had a problem. • His policies pushed his country, once called the breadbasket of Africa, to the verge of starvation. • With nothing left to tax he turned to the last refuge of needy governments, the printing press. • Result: Hyperinflation • Inflation went from 50 percent a year to 50 percent a month to 50 percent a day!
Introduction • In this chapter, we learn… • How inflation is defined and measured • What causes inflation • The costs and benefits of inflation • Why governments sometimes resort to inflation.
Defining and Measuring Inflation • Inflation: an ↑in the average level of prices. • Measured using the following formula. • The average change of all prices. • Some prices go up and some go down. • Think of an elevator containing many prices that change relative to each other. As the elevator rises, all of the prices rise. The following figure may help. Where Pt is the average price level in year t
Defining and Measuring Inflation At any one point in time some prices are going up and some are going down. Inflation is an increase in the price level.
Defining and Measuring Inflation • Price Indexes are used to measure inflation. • An index is a number that compares the price level in one period relative to the prices in some base year. • An index is only a number; it is not expressed in dollars. • There are several price indexes • Consumer price index (CPI) • Producer price index (PPI) • GDP deflator • Let’s take a closer look at each of these…
Defining and Measuring Inflation • CPI: The average price of goods bought by a typical American consumer. • Covers 80,000 goods. • Weighted so that higher priced items count more. • Producer price indexes (PPI): The average price received by producers. • Includes intermediate goods as well as final goods. • GDP deflator: Measures the average price of all final goods and services.
Defining and Measuring Inflation • Inflation in the United States and Around the World • Using the CPI to calculate real prices • Real price is the price of a good that has been corrected for inflation. • Example: • 1982 price of gasoline was $1.25/gal • 2006 it was double that at $2.50/gal. • CPI was 100 in 1982 and 202 in 2006. • Conclusion: The real price of gasoline was about the same in 2006 as it was in 1982.
Defining and Measuring Inflation • Inflation in the United States and Around the World (cont.) • Hyperinflation: extremely high rates of inflation that make inflation in the U.S. look pretty tame by comparison. • A lot of governments have fallen into the trap of inflating their currency in order to pay debts. • The next table shows some pretty dramatic examples.
Defining and Measuring Inflation • Inflation in the United States and Around the World (cont.)
Defining and Measuring Inflation • Inflation in the United States and Around the World (cont.) • Hungary’s hyperinflation is the highest on record. • What cost 1 Hungarian pengo in 1945 cost 1.3 septillion pengos at the end of 1946. • Prices doubled every 15 hours! World's highest denomination banknote Hungary (1946) 100 Quintillion pengo 100,000,000,000,000,000,000
If the CPI was 120 this time last year and is 125 right now, what is the inflation rate? • If the inflation rate goes from 1 percent to 4 percent to 7 percent over two years, what will happen to the prices of the great majority of goods: will they go up, stay the same, go down, or do you not have enough information to say? • Why do we use real prices to compare the price of goods across time?
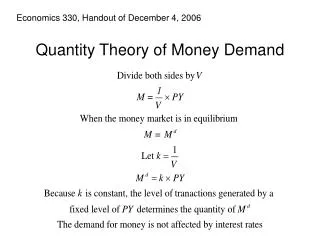
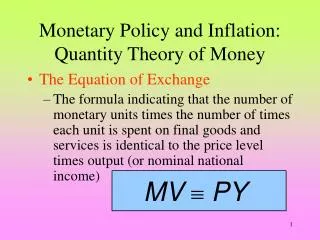
The Quantity Theory of Money • The quantity theory of money does two things: • Sets out the general relationship between inflation, money, real output, and prices. • Presents the critical role of the money supply in regulating the level of prices. • For the nation as a whole… • Velocity (v):average number of times that a dollar is spent on goods and services in a year.
The Quantity Theory of Money • The quantity theory of money depends on two assumptions… • Real GDP is stable compared to the money supply. • Real GDP is fixed by the real factors of production—capital, labor, and technology. • The growth rate of real GDP is limited by how fast these factors can increase.
The Quantity Theory of Money • The quantity theory of money depends on two assumptions…(cont.) • The velocity of money, v, is stable compared to the money supply. • It is determined by various factors such as: • Whether workers are paid monthly or biweekly. • How long it takes to clear a check or electronic transaction. • How easy it is to find an ATM. • Factors like these may change, but they will change slowly.
The Quantity Theory of Money • The Cause of Inflation • The quantity theory is a theory of inflation. • If YRis fixed by real factors of production and vis stable, then it follows that inflation is caused by an increase in the supply of money. • The quantity theory of money can also be written in terms of growth rates: • Which translates as: • Growth rate of money + growth rate of v is identically equal to the rate of inflation + growth rate of real GDP.
The Quantity Theory of Money • The Cause of Inflation (cont.) • Important implication: If the growth rates of vand YRare small compared to the growth rate of M, the rate of inflation will be approximately equal to the increase in money supply. • Or more generally:
The Quantity Theory of Money • The Cause of Inflation (cont.) • One of the most important truths of economics. • “Inflation is always and everywhere a monetary phenomenon”, Milton Friedman, Nobel Prize Winner • Milton Friedman (1912-2006) • Ph.D. - Columbia University • Professor - University of Chicago • Leader of the Chicago “school of economics”
The Quantity Theory of Money • The Cause of Inflation (cont.) • How well does the theory hold up?
The Quantity Theory of Money • The Cause of Inflation (cont.)
The Quantity Theory of Money • The Cause of Inflation (cont.) • Some Important Caveats: • If M and v grow more slowly than YR,prices will fall; this is called deflation. • Changes in velocity will affect prices. • Hyperinflation: People will spend their money faster (increase v) → even faster increase in prices. • Great Depression: Fear → ↓spending (decreased v) → deflation → worse depression. • In the long run, money is neutral.
The Quantity Theory of Money • An Inflation Parable • Under some circumstances, changes in M can temporarily change YR. Let’s see how… • Consider a mini-economy consisting of a baker, tailor, and carpenter who buy and sell products among themselves. All three work harder to increase output and raise their prices. Government prints money to pay army Soldiers buy from baker, tailor, and carpenter At first When the baker, tailor, and carpenter go to buy from each other, they find they are no better off than before because of higher prices Eventually they catch on and stop working harder to produce more output. • Conclusion: Increase in M can boost the economy in the short run but as firms and workers come to expect and adjust to the influx of new money, output (real GDP) will not grow any faster than normal.
In the long run, what causes inflation? • What is the equation that represents the quantity theory of money?
The Costs of Inflation • If all prices including wages are going up, then what is the problem with inflation? • We will look at four problems with inflation. • Price confusion and money illusion. • Inflation redistributes wealth. • Inflation interacts with other taxes. • Inflation is painful to stop.
The Costs of Inflation • Price Confusion and Money Illusion • Price confusion • Inflation makes price signals more difficult to interpret. • A decision maker does not always know if the price of a product is increasing… • Because of increased demand or • As a result of all prices going up with inflation.
The Costs of Inflation • Price Confusion and Money Illusion (cont.) • Money Illusion: when people mistake changes in nominal prices for changes in real prices. • Example: Mary receives a 10% increase in salary. Feeling she can now afford it, she takes on a higher mortgage payment. The rate of inflation is 10% and she is no better off in terms of real salary. She now has a higher house payment and is in danger of losing her home. • Result: resources are wasted in unprofitable activities.
The Costs of Inflation • Inflation Redistributes Wealth • Inflation is type of tax. It transfers wealth to the government. • Even tax cheats can’t avoid this tax! • Governments that print money to pay their bills are using this type of tax. • Inflation redistributes wealth among the public. • The real rate of return for a lender is given by…
The Costs of Inflation • Inflation Redistributes Wealth (cont.) • Example: • Suppose a bank makes a 30 year home loan at an interest rate of 7%. If the rate of inflation is 3% over that period: bank’s actual rate of return = 7% - 3% = 4% • If inflation rises unexpectedly to 13% as it did in late 1970s, the actual rate of return = 7% - 13% = - 6%! • The lender is now losing money on the loan. • The borrower gains.
The Costs of Inflation • Inflation Redistributes Wealth (cont.) • What happens if people expect inflation to go up? • Lenders will increase nominal rates of interest. • Fisher effect:the tendency for nominal interest rates to rise with expected inflation. • This effect says that the nominal rate of interest will be equal to expected inflation rate plus the equilibrium rate of return. • The Fisher effect is seen in the next diagram.
The Costs of Inflation • Inflation Redistributes Wealth (cont.)
The Costs of Inflation • Inflation Redistributes Wealth (cont.) • The actual rate of return: determined in large part by the difference between expected inflation and actual inflation. • From earlier equations we have: • Substituting i from equation (2) into equation (1) we get: • The following table summarizes what we learn from this result.
The Costs of Inflation • Inflation Redistributes Wealth (cont.)
The Costs of Inflation • Inflation Redistributes Wealth (cont.) • Monetizing the debt:when the government pays off its debts by printing money. • Why don’t they always inflate their debt away? Two reasons: • The Fisher effect: if banks know the government is doing this, they will simply raise interest rates. • Political cost: People who buy government bonds usually vote.
The Costs of Inflation • Inflation Redistributes Wealth (cont.) • Workers and firms are affected by inflation. • Wage agreements are often made several years in advance. • Underestimating inflation → wages being too low → supply of labor: too low. • Overestimating inflation → wages being too high → demand for labor: too low. • Conclusion: errors in estimating the rate of inflation → a misallocation of resources → lower economic growth.
The Costs of Inflation • Inflation Redistributes Wealth (cont.) • Hyperinflation and the Breakdown of Financial Intermediation • If inflation is moderate and stable: • Lenders and borrowers can forecast well. • Loans can be signed with rough certainty regarding the value of future payment. • If inflation is high and volatile: • Long-term risk becomes high and loans may not be signed at all. • Financial intermediation breaks down. • Let’s look at some examples…
The Costs of Inflation • Hyperinflation and the Breakdown of Financial Intermediation (cont.) • Peru (1987-1992) • Private loans virtually disappeared. • Investment fell and the economy collapsed. • Mexico • 1980s: Inflation rate at times exceeded 100%. • Long-term loans were hard to get. • As recently as 2002, 90% of debt matured within one year. • Since the 1990s: inflation has been tamed. • Result: rapidly growing capital markets and increased investment.
The Costs of Inflation • Inflation Redistributes Wealth (cont.) • Conclusions: • Unexpected inflation redistributes wealth throughout society in arbitrary ways. • When inflation is high and volatile • Unexpected inflation is difficult to avoid. • Long-term contracting grinds to a halt. • Result: economic growth suffers.
The Costs of Inflation • Inflation Interacts with Other Taxes • Inflation will produce tax burdens and tax liabilities that do not make economic sense. • People pay taxes on illusory capital gains. • Example: Taxes are collected on nominal capital gains. • Results: • Longer-run effect is to discourage investment in the first place. • Inflation increases the costs of complying with the tax system.
The Costs of Inflation • Inflation is Painful to Stop • Slowing down the money supply can create a recession. • A good lesson: • Inflation in 1980 was 13.5%. • Tough monetary policy reduced the rate of inflation to 3%, but the consequence was… • The worst recession since the Great Depression. • Unemployment rate over 10%. • The unemployment rate didn’t return to near 5.5% until 1988.
Consider unexpected inflation and unexpected disinflation. How is wealth redistributed between borrowers and lenders under each case? • What happens to nominal interest rates when expected inflation increases? What do we call this effect? • What does unexpected inflation do to price signals?
Takeaway • Inflation is an increase in the average level of prices as measured by an index such as the CPI. • Sustained inflation is always and everywhere a monetary phenomenon. • Inflation makes price signals difficult to interpret. • This is especially true when people may suffer from money illusion.
Takeaway • Workers and firms adjust to predictable inflation by incorporating inflation rates into wages and contract agreements. • Anything above a mild sustained inflation is bad for the economy.
Chapter 11 Appendix: Get Real! An Excellent Adventure
Get Real! An Excellent Adventure Suppose you want to convert a nominal data series into a inflation-corrected or real data series. Step I: Download your data into a spreadsheet. Source: http://www.census.gov/const/www/newressalesindex.html
Get Real! An Excellent Adventure Suppose you want to convert a nominal data series into a inflation-corrected or real data series. Step I: Download your data into a spreadsheet. Step II: We need a price index. Input your data into your spreadsheet.
Get Real! An Excellent Adventure Suppose you want to convert a nominal data series into a inflation-corrected or real data series. Step I: Download your data into a spreadsheet. Step II: We need a price index. Input your data into your spreadsheet. Step III: Calculate your deflator. You do this by dividing all of the CPIs by the CPI in the period you use as the “base period”. In this case it is August 2006. The deflator equals 1 in the base period.
Get Real! An Excellent Adventure Suppose you want to convert a nominal data series into a inflation-corrected or real data series. Step I: Download your data into a spreadsheet. Step II: We need a price index. Input your data into your spreadsheet. Step III: Calculate your deflator. You do this by dividing all of the CPIs by the CPI in the period you use as the “base period”. In this case it is August 2006. The deflator equals 1 in the base period. Step IV: Divide the average house price by the deflator. Result: There has been a real increase In the price of housing. What would cause this?