Download
1 / 57
570 likes | 674 Views
King’s CRYSTAL Center for Visualization in Science Geowall and Beyond…. A Brief Word from our Sponsor…. The following is a collaboration between the Visualization Center for Science Education at The King’s University College and The CRYSTAL-Alberta project. Hence forth ….

E N D
King’s CRYSTAL Center for Visualization in ScienceGeowall and Beyond…
A Brief Word from our Sponsor… • The following is a collaboration between the Visualization Center for Science Education at The King’s University College and The CRYSTAL-Alberta project. Hence forth … The King’s Crystal Center for Visualization in Science
The Plan… • GEOWALL – a quick tour of the technology and 3 examples of it in use • The King’s Crystal Center for Visualization in Science • Past • Present • Future
Welcome to GEOWALL! GEOWALL in use during lecture at the Gordon Research Conference in Visualization in Science July 2005, Oxford UK
I. Geowall – Technical Considerations • Uses 2-matched DLP projectors (“left” & “right”) each outputting a plane polarized image rotated 900 wrt the other. • Screen is “daylite” type – polarization preserving • Eyeglasses “decode” left and right eye information – your brain does the rest!
Geowall – Technical Considerations Left-channel image Right-channel image Right channel image is projected through the right channel DLP projector and is plane-polarized as shown Left channel image is projected through the left channel DLP projector and is plane-polarized as shown
Geowall – Technical Considerations • Projectors are stacked vertically with 3 rotational and translational degrees-of-freedom • Computer should be equipped with a video board capable of running 2 monitors • Passive stereo – image “stacking” • Crude alignment can be achieved using separate monitor windows from each projector
Geowall – Technical Considerations • Left and Right channel polaroids are placed in front of the lens – avoid touching the lenses as conducted heat will quickly (< 1 hour) degrade filters • Final alignment achieved by using stereoviewer and the Geowall alignment image Not quite! Good (not perfect)! Better Congratulations – you are ready for stereo projection!
More on Creating Stereo Images • Digital Camera • Two images contain all of the stereo information needed for your brain to produce a stereo pair Translate camera L to R
More on Creating Stereo Images • 3D Image rendering software • Blender – freeware (outstanding package but steep learning curve) • Bryce (more accessible but not free) • Either offset “camera” or scene and render both L and R channel images.
III. Free Software that Supports Stereo Projection • Chemistry/Biology: • JMOL • Pymol • VMD • Protein Explorer • Physics/Astronomy • VPython • Astrowall suite • Wallview
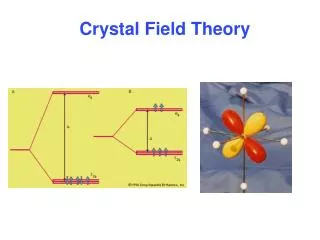
GEOWALL – 3 examples • Looking a CRYSTAL Structure (VMD) • Visualizing Hoffmann Structures (VMD) • Visualizing the magnetic field in a solenoid (VPYTHON)
The King’s Crystal Center for Visualization in Science • Past • MAP project • Gordon Research Conferences • Applet Development with/for Alberta Learning
The King’s Crystal Center for Visualization in Science • Present • NSF Global Climate Change (Mahaffy, Stief, Geelan, Simmon, Martin) • CRYSTAL Visualizing the Unseen • Grade 5 science: visualizing Carbon Dioxide as it applies to climate and chemistry (Gustafson, McDougal at al) • Applying GEOWALL to visualizing chemical structures (Mahaffy, Martin, Vederas, et al) • Visualizing subatomic phenomena (Martin, Brouwer, Visser et al) • CRYSTAL Global Climate Change • Science 10: Energy Flow in Global Systems (Geelan et al) • CRYSTAL Visualization: State of the Art Review (Philips et al)
The King’s Crystal Center for Visualization in Science • Future • Provide an ongoing resource for CRYSTAL projects • Expertise in: HyperChem, FLASH/ActionScript, JAVA, BRYCE, QuickTimeVR, GEOWALL, etc • Access to programmers and visualization specialists • Quick prototyping and “proof of concept”
What is MAP? A six-year project involving collaboration of 3 post-secondary institutions in the province of Alberta (King’s University College, U. of Calgary, U. of Alberta) as well as the Ministry of Education for the Province of Alberta. MAP provided high quality learning, WWW-deliverable objects for the teaching of the first 3 terms of university level Physics and scalable to meet the needs of most high school curricula
So who are we?... • Project MAP Executive Directors: David Austen, Wytze Brouwer, Hans Laue, Brian Martin • Project Associates: Terry Singleton, Peter Wright • Programmers (MAP_North): • Nathan Laan, Dave Ooms, Phil Martin, Peter Uitvlught, Rob McQuarrie, Tyler Luchko, Mike Schuurman, Brian Martin • FLASH: Travis Whyte, Leah Martin • Content: Leah Martin, Nicole Albert, Melody Russel, Brian Martin
A closer look at MAP • Highly modularized collection of “learning objects” including: • over 150 applets and applications (some current applets)(Jeremy Walton version) • extensive FLASH animation library • Video and Lab interfacing via JAVA applications • student tutorial modules • extensive interactive questions with attention paid to conceptual questions as well as numeric response • Objects can be stand-alone or embedded within user designed navigation tools
Some terms… • Learning object: a small, concept focused content item (applet, Flash animation, QT movie etc) • Applet: small program created in JAVA and intended to be transmitted via the web • Application: stand-alone program in JAVA to be installed and run locally on a user’s machine
Pedagogic Design and Philosophy • MAP is built on a constructivist learning model and all learning objects are designed to encourage (demand?) student interactivity • Concept focused • Tutorial modules are usually designed to involve a pair of students in conversation but can run “solo”
Classifying Applets by Function • Address pre-conceptions • Augment student experience • Bridge the transition from conceptual to quantitative • Aid in the visualization of complex phenomena
Designing Applets which Address Pre-conceptions • they are designed to address a well-known preconception (i.e. one identified in the research literature) • they are entirely qualitative in both “input” and “output” • they allow the student to draw directly on the applet the expected outcome and then to compare this with the “correct” result simulated by the computer • the applets are designed to be attractive and “non-intimidating”
Applets that augmentstudent experience... • 2-Dimensional Motion(vectoral nature of acceleration and velocity) • Encourages “interaction” or playwith the ideas of velocity and acceleration • "This gadget really helps visualize it!" • "I can see it happening." • "It was nice to see the ball moving so we can picture the skateboarder or whatever we are looking at" • "… good assignment …" • "The assignment was good, but it would be better if it did not take 10 minutes to get into the program. I could probably do it from home much faster" • "It would have been okay, except for the problems with the computer" • "This program is interesting, but not for a very long time" • "I thought learning this way was extremely difficult and hard to understand. I prefer note taking and chances to ask you questions when they arise." • "I'm not good with the computer - too slow of a connection" • "This was awesome and fun"
Applets that Bridge the Transition from Conceptual to Quantitative • Circuit Builder
Applets that Bridge the Transition from Conceptual to Quantitative • The Incline • Visualization of force vectors • Graphical visualization tools • Can stimulate “what if…” questions
Applets that Bridge the Transition from Conceptual to Quantitative • Man on the Ladder
Applets that Bridge the Transition from Conceptual to Quantitative • Atwood’s Pulley
Applets that Help the Student Visualize Complex Phenomena • Sonic Booms
Applets that Help the Student Visualize Complex Phenomena • Car on a banked roadway
Applets that Help the Student Visualize Complex Phenomena • Ripple Tank
Applets that Help the Student Visualize Complex Phenomena • Slit-Diffraction
Applets that Help the Student Visualize Complex Phenomena • Thin Film Interference
Does MAP Work? • Efficacy of MAP materials in improving conceptual understanding and affecting attitude was the principal burden of Dr Guoqiang Zhou’s doctoral work (2001) in The Department of Secondary Education, University of Alberta • Currently 2 graduate students are studying the problem of teacher implementation of MAP and student “receptivity” to MAP • Force Concept Inventory Test or FCI (Hestenes et al 1992, Mazur, 1997) has been administered to 7 first year classes at the U. Alberta (n = 600) divided as 4 control groups and 3 treatment groups. All three treatment groups demonstrated a statistically significant improvement in performance on FCI post-tests compared to their control group counterparts.
Does MAP Work? • Teacher training is essential! • MAP materials do not appear to be effective in changing student attitudes about physics as a discipline.
New Directions for MAP • Applets incorporating Video and Simulation • Further Development of VideoLab • Extensive teacher in-servicing. • Participation in a cross-cultural study • Develop a national (Canadian) centre
Technical Info... • Applets run under JAVA 1.4.n- Sun Plugin (PC, LINUX) or OS X (Mac) • Require JMF 2.1.1 (PC and LINUX only) for VideoLab • Applet design makes extensive use of libraries (approx. 1 Meg initial download, individual applets typically 50K - 100 K) • Applets are signed using THAWTE certificates and can access required peripherals (printers, files etc)
Basic Constructivist Tenets • Successful science teaching must develop strategies and tools that acknowledge the existence of powerful, preexistent frameworks of ideas which students bring to bear on the ideas that we teach • Constructivist teaching provides students with sufficient experiences to interact with their held beliefs and to enable students to construct their own understandings of concepts and ideas.
Visualization at The King’s University College Peter Mahaffy Brian Martin
Visualization is an integral part of learning: • Seeing and perception • Seeing in the “Minds Eye” • Visualization as metaphor for perceiving • Visualization plays a critical role in understanding – both the understanding of the student as well as the understanding of the researcher • Use of visualizations at King’s plays a vital role in our work with science students… BUT!...
The Myth of Visualization as “Seeing is Believing” • A Simple Task… • Watch the white team and count the exact number of times the white team passes the ball back and forth
The King’s Center for Visualization in Science (KCVS) • Explore ways in which visualization (not just computer based) can be used to enhance understanding: • Among students • Among researchers • Explore ways to implement visualizations into teaching at both secondary and post secondary levels • To work within international communities of scholars researching topics related to visualization
KCVS: Past, Present, Future • Modular Approach to Physics Project (MAP) 1997 – 2004 • Gordon Research Conferences • Centres for Research in Youth, Science Teaching and Learning - CRYSTALS
King’s, KCVS and CRYSTALS • 5 year, 200K/a, Mahaffy (co-PI), Martin (management team &co-PI) • Project involves U of A, King’s, 3 other post-secondaries, Edmonton Schools, Telus World of Science and others • Current projects KCVS will play a role in: • Visualizing Global Climate Change (with NSF) • Ethical Use of Chemicals (with IUPAC)
Applets that Help the Student Visualize Complex Phenomena • Car on a banked roadway
Visualizing the World Too Small To See: Small Matters Christina deMatteis, University of Nottingham
The Importance of Multiple Representations at the Molecular LevelRoy Tasker, Univ. Western SydneyModels in Chemistry “The most powerful thing you can do when you’re learning chemistry is to zoom down, in your mind’s eye, to the molecular level and try to imagine what is going on and in a sense, try to understand the personalities of the reactants and products… Having each type of model show a different aspect is ideal. Because then students don’t look at a particular model and say: that’s reality.”
"Since garlic hath powers to save from death, bear with it though it makes unsavory breath"Robert of Normandy, 1100 AD • Literature Reports • Allium sativum • Broad spectrum antibacterial activity, including Helicobacter pylori • Antifungal activity • Antiviral activity • Normalization of plasma lipid levels • Stimulates lymphocytes and elicits anti-tumor effects • Anti-hypertensive effects • Bacillus anthracis inhibition?
Several compounds inhibit Bacillus subtilis growth 2D TLC of dichloromethane garlic extract 2nd Dimension–More Polar Solvent 1st Dimension – Less Polar Solvent Initial Spot