Download
1 / 18
180 likes | 252 Views
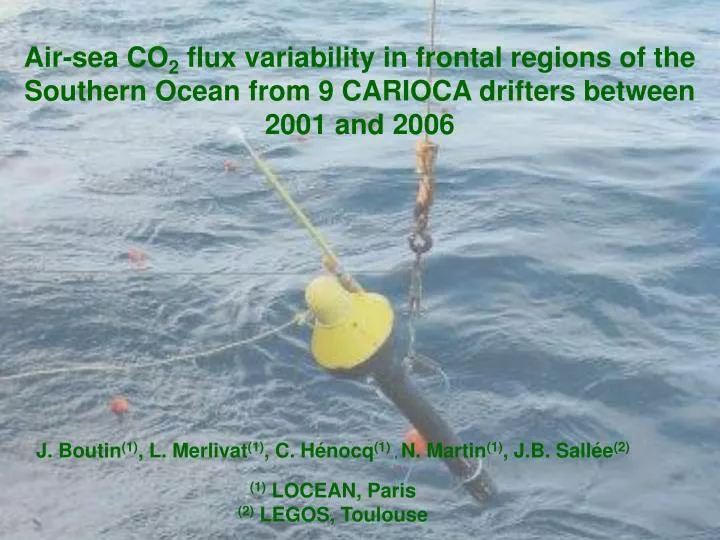
Air-sea CO 2 flux variability in frontal regions of the Southern Ocean from 9 CARIOCA drifters between 2001 and 2006. J. Boutin (1) , L. Merlivat (1) , C. Hénocq (1) , N. Martin (1) , J.B. Sallée (2) (1) LOCEAN, Paris (2) LEGOS, Toulouse.

E N D
Air-sea CO2 flux variability in frontal regions of the Southern Ocean from 9 CARIOCA drifters between 2001 and 2006 J. Boutin(1), L. Merlivat(1), C. Hénocq(1) ,N. Martin(1), J.B. Sallée(2) (1) LOCEAN, Paris (2) LEGOS, Toulouse
9 CARIOCAs deployed in Southern Ocean (south of subtropical front; ~40S-50S) sampled SAZ and PZ during all seasons CARIOCA TRAJECTORIES (Carioca # are color coded) Subtropical front from Orsi Climatology Polar front from sea surface height (Sallée et al., 2007) North-Subantarctic front from sea surface height (Sallée et al., 2007) SAZ: Subantarctic zone between SAF and STF (SSS<34.9) PZ: Polar zone between PF and SAF
9 CARIOCAs deployed between 2001 and 2006 sampled SAZ and PZ during all seasons CARIOCA TRAJECTORIES (Carioca # are color coded) CARIOCA TRAJECTORIES (Months are color coded)
CARIOCA drifters • Ocean measurements at 2m depth: • fCO2 (accuracy <3matm) • SST • SSS • Fluorescence • Atm. measurementsof: • Wind speed • Atm. Pressure • Trajectory influenced by : • 15m depth currents Autonomy: about 1 year DIC deduced from fCO2, SST and SSS assuming Alk/SSS relationship (Lee et al, 2006) => large scale accuracy ~10mmol/kg F=k S DfCO2; k-U rel. of Wanninkhof (1992) (22% higher than Ho et al. (2006) rel.)
CARIOCA measurements Dissolved Inorganic Carbon
SAF In PZ: DIC between 2080mmol/kg and 2120mmol/kg (except during one episodic event in Sept. on PF close to 9W-49S) –seasonal variation<30mmol/kg In SAZ: DIC between 2020mmol/kg and 2120mmol/kg; decrease of DIC from SAF to STF; at a given distance to the SAF, seasonal variation of about 30mmol/kg with maximum in Aug-Oct and minimum in Jan-March
Decrease of DIC from SAF to STF Seasonal variation (about 30 mmol/kg): min in Summer, max in Winter Larger scatter in Summer Fall (biology effect?)
In SAZ: decrease of fCO2 from SAF to STF in Winter-Spring (formation of SAMW close to SAF) More scatter at the end of Spring-Summer (biological effect?)
Air-sea CO2 fluxes integrated by seasons in PZ and SAZ Due to large surface, low fCO2 and large winds, SAZ is a strong sink for atmospheric CO2 (-0.8 PgC yr-1)
Summary 65 months of CARIOCA measurements in SAZ and PZ • SAZ strong sink (-0.8PgC yr-1) contrary to PZ (-0.1PgC yr-1) • Seasonal variation of DIC in SAZ (~30mmol kg-1) but no seasonal variation of air-sea CO2 flux Conclusions very similar to McNeil et al. (2007) findings: -Sink of 1.1+/-0.6PgC yr-1 between 40S and 50S -Summertime depletion of DIC of 30-50mmol kg-1 but ~nofCO2 variation -Weak sink in PZ Future studies -Compare these results with new CARBOOCEAN CARIOCA and ship measurements (see L. Barbero poster) => uncertainty on flux estimate
March 2008 GasEx 3 Future studies Compare these results with new CARBOOCEAN CARIOCA and ship measurements (see L. Barbero poster)
Increase of DIC close to SAF is consistent with the distribution of the deep mixed layer in the Southern Ocean, where Subantarctic Mode Water (SAMW) forms (Aoki et al. 2007) CARIOCA DIC Distribution of mixed layer depths (July to September), derived from (a) OFES and (b) Argo profiling float data. Blank areas in Figure 1b denote regions of inadequate sampling. Thick lines denote the Subtropical Front (STF) and Subantarctic Front (SAF), as defined by Orsi et al. [1995]. Aoki et al, JGR, 2007
Why study the southern ocean (south of Subtropical front; ~40S-50S)? • Large undersaturations of CO2 observed in surface waters; large area; strong wind speeds => region suspected to be a strong sink of CO2 But: • Discrepancy of about a factor 2 between air-sea CO2 fluxes estimated by various methods (36S-56S) (Gloor et al. 2003) • Large uncertainty in atmospheric inversions: e.g. Patra et al. 2005: uncertainty of 1.21PgC yr-1 (45S-60S), Baker et al. 2006: long term flux (1992-1996; south of 45S): -0.28 to -0.55PgC yr-1 • Few measurements, especially in winter
Example of SAF ‘altimetric’ front detection DIC (mmol/kg) SAF
High DIC, low SST, low SSS close to SAF in the Pacific in Sept-Oct SAF 10 7 34.7 34.3 DIC
SAF In PZ: fCO2 between 330matm and 390matm – no clear seasonal variation In SAZ: fCO2 between 400matm and 290matm; decrease of fCO2from SAF to STF in Winter-Spring ; no evidence of seasonal variation
Air-sea flux of CO2 along buoys trajectories (Use of k-U relationship of Wanninkhof, 1992) and QSCAT wind speeds