Download
1 / 49
490 likes | 679 Views
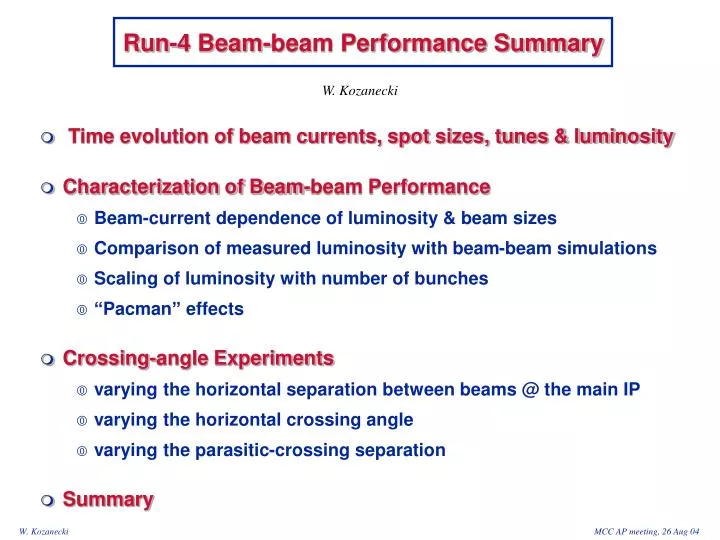
Run-4 Beam-beam Performance Summary. W. Kozanecki. Time evolution of beam currents, spot sizes, tunes & luminosity Characterization of Beam-beam Performance Beam-current dependence of luminosity & beam sizes Comparison of measured luminosity with beam-beam simulations

E N D
Run-4 Beam-beam Performance Summary W. Kozanecki • Time evolution of beam currents, spot sizes, tunes & luminosity • Characterization of Beam-beam Performance • Beam-current dependence of luminosity & beam sizes • Comparison of measured luminosity with beam-beam simulations • Scaling of luminosity with number of bunches • “Pacman” effects • Crossing-angle Experiments • varying the horizontal separation between beams @ the main IP • varying the horizontal crossing angle • varying the parasitic-crossing separation • Summary
by-2 L/H current ratio Run 4 beam-current & bunch-number history LER total current HER total current # bunches
Specific luminosity Run 4 Luminosity History e+ bunch current Luminosity e- bunch current
29 Oct-29 Jan 29 Jan –30 Apr 30 Apr – 31 Jul Luminosity vs. I+ * I- 1 Oct 03-31 Jul 04
= in single-beam mode LER x-size LER y-size HER x-size HER y-size
LER y-tune (msrd) LER x-tune (msrd) HER x-tune (msrd) HER y-tune (msrd)
The LER & HER x-tunes track each other closely (as predicted by beam-beam simulations) LER x-tune (msrd) HER x-tune (msrd)
J. Seeman PEP- II Peak Collision Parameters IP parameterJun 03Apr 04Jul 04 L (x 1033/cm2/s) 6.57 8.33 9.07 Lsp (x 1030/cm2/s) 3.73 4.20 3.86 # bunches 1034 1549 1616 ILER (mA, e+) 1550 2230 2450 IHER (mA, e-) 1175 1380 1550 ILER / bunch (mA/b) 1.50 1.44 1.52 IHER / bunch (mA/b) 1.14 0.89 0.96 ILER / IHER ratio 1.3/1 1.6/1 1.6/1 by*/bx* (cm/cm) 1.2 / 40+, 1.2 / 28- 1.1 / 48+, 1.1 / 28- 1.05 / 32+, 1.05 / 32- e (nm-rad) (y/x) 1.8 / 30+, 1.8 / 49- 1.0 / 30+, 1.3 / 59- 1.55 / 33+, 1.30 / 60-[New sim. parms by YC/WK/JS, 11 Aug 04: 1.40 / 22+, 1.30 / 59-] xy (+/-) .082/.040 0.067 / 0.046 0.065 / 0.043 xx (+/-).109/.040 0.086 / 0.0320.053 / 0.052
W.K. Current dependence of L & beam sizes: HEB scan 27 Jan 04 By-2 pattern 1320 bunches 31 Jul 04
HER-current dependence of L & beam sizes in Jan 04: observations • In single-beam mode, the HER beam sizes are current-independent • When the HER current increases (with the LER fixed @ nominal I+) • the specific luminosity first rises, then turns over. • Lsp reaches a broad maximum around 0.5 mA/b • specific luminosity comparable at the highest & lowest HER bunch currents • as a function of the beam-current product, the total luminosity (in Jan 04) • exhibits only moderate saturation • is mostly limited by transverse losses (lifetime, beam-beam bgds) [Jul 04: ??] • the LEB blows up transversely with rising HER current • 65% [40%] increase in x, 23%[10%] in y @ the SLM/interf. (wrt single beam) • the evolution of the transverse e+ loss rate is consistent with blowup in both x & y, and confirms a significant Touschek contribution to the LEB lifetime • the HEB experiences both ‘LEB-induced’ & ‘self’ blowup • up to 0.8 mA/b, the x-size remains constant (4 % > single beam), then blows up by an additional ~ 4-7% (8-11% total blowup) • the y-size first decreases (50% 25% blowup, then back up to 40%). Its HER-current dependence largely mirrors that of the specific luminosity • evolution of transverse e- loss rate consistent with the blowup pattern above • Jul 04: smooth extrapolation from above, except LER x,y blowup
Current dependence of L & beam sizes: LEB scan By-2 pattern 1320 bunches 27 Jan 04 31 Jul 04
LEB-current dependence of L & beam sizes in Jan 04: observations • In single-beam mode, the LER beam sizes are current-independent • When the LER current increases (with I- fixed @ nominal ) • Lsp remains roughly constant, except at the highest LER current • 5 % decrease in Lsp observed for ib+ > 1.0 mA/b[Jul 04: 10-15% for ib+ ~ 1.5] • the dependence of the total luminosity on the beam-current product • exhibits only moderate saturation; however, raising the LEB current gains little L • is limited by transverse losses (lifetime, beam-beam backgrounds) [Jul 04: ??] • the transverse LEB size • in x: remains constant in the horizontal plane, but 60-70% larger than in LEB-only mode [Jul 04: 40-50% larger than single beam] • in y: varies from 1.2 to 1.3 times its single-beam value as I+ increases [Jul 04: 1.1-1.2] • the evolution of the transverse e+ loss rate suggests moderate or no variation of the blowup level with increasing positron current • the transverse HEB size • in x: varies from 1.04 to 1.08 times its single-beam value as I+ increases [Jul 04: 1.10-1.15] • in y: rises rapidly with LEB current, up to 1.4 times its single-beam value [Jul 04: 1.6 times] • both horizontal & vertical loss rates rise sharply for ib+ > 1.2 mA/b
Main features in Jul 04 (vs. Jan 04): less LER x,y blowup, more HER y blowup LEB scan (continued)
Data: 27 Jan 04 Beam blowup: beam-beam (both) + Touschek (LER)
Simulations: Y. Cai / I. Narsky Comparison of measured luminosity with b-b simulations • Beam-current dependence of Lsp • Absolute scale: 15-20 % agreement • Current-dependence steeper in data • Uncertainties: • assumed values of b, e, sz • lattice non-linearities (not incl’d) Luminosity in by-3 pattern (no parasitic Xings) 20 Oct 03
Vertical blowup (LER ??) Dynamic b BaBar lum. region Beam-beam simulations: Lsp & IP spot sizes Simulations: I. Narsky Parameter set: 2003
s = eb , s’ = e/b Simulation s, s’ eeff, beff @ each current x 1.3 x 2.3 Beam-beam simulations: dynamic e, b • dynamic-e growth strongest in the LER: sensitive to input sim. assumptions? Also see 13% (6%) dynamic b*y in LER (HER)
Y. Cai Beam-beam simulations: from the IP to the SLM • The beam matrix at the SLM (S) can be related to that at the IP (S*) by with, for instance • The transformation matrix M can be obtained from • the design lattice (as done here) • MIA (does not work as well because coupling parameters not measured accurately enough) • This allows to predict the SLM/interferometer spot sizes if one “knows” the IP spot sizes (from simulation) • For the full formalisnm, see Yunhai’s presentation of 18 May 04: http://www.slac.stanford.edu/~yunhai/talks/Transformation.pdf
Measured beam sizes: data vs. simulation Y. Cai / I. Narsky Parameter set: 2003 x 1.7 mainly e blowup x 2.5 dyn. eand b-beat x 1.4 + 17% mainly dyn. e + 23% mainly e blowup
Measured beam sizes: data vs. simulation Y. Cai / I. Narsky Parameter set: 2003 The order of magnitude is right, and some of the qualitative features agree nicely (large horizontal LEB blowup finally explained, significant vertical HEB blowup). The fact that the simulation tends to overestimates the blowup (except for the vertical HEB size) may be due to differences between the actual tune and that in the simulation: dynamic-b effects are very sensitive to small tune changes near the ½ integer. The large b-beats present in both rings may also play a role..
W.K. Dec 03 data Bunch-number dependence of specific luminosity • Motivation: is L/bunch independent of the number of bunches ? • Principle: measure L, Lsp, beam sizes, tunes,... • varying only the # of bunches (not the bunch separation within a train) • at constant bunch currents • Procedure • bunch currents representative of stable trickle running: LER/HER ~ 1.4/1.0 mA/b • start with a sparsified pattern, then progressively ‘fill it up’. • by-2, 94 trains, 6 bunches filled, 12 empty bunches (total bunches = 584) • .... • by-2, 94 trains, 13 bunches filled, 5 empty bunches (total bunches = 1228) • for each pattern • top-off both rings • optimize tunes on Luminosity
Bunch-number dependence of specific luminosity: conclusions • The specific luminosity remains independent of the bunch pattern, with an accuracy of a few %. Experimental conditions: • by-2 pattern • the number of buckets varies from 584 to 1228 • the bunch currents are the same in the various patterns • Data taken on 31 Jul 04 remain to be analyzed Ib+ = 1.434 mA/b 0.96 < Ib- < 1.00 mA/b
A. Novokhatski Apr 04 “Pacman” effects (I): bunch pattern 3 Apr 04 1415 bunches 3 Apr 04 1512 bunches
Data: 1 Jul 04 “Pacman” effects (II): e- x angle experiments • How do the Pacman bunches fare? • What is happening in the long minitrain?
Collision phase jumps Long train suppressed Lsp = f(Xing Ang) Parasitic crossings: how do the Pacman bunches fare? W. Colocho Data: 1 Jul 04 • Plot Lsp / Lspmax @ XP=0 • bins of XP(e-) (0 = opt) • regular minitrains only • nominal currents • Lsp optimized at each e- angle Bucket # Bucket # Sparsified by-2 pattern, crossing angle MD of 1 Jul 04
Pacman & regular bunches: sensitivity to e- x-angle W. Colocho Data: 1 Jul 04 • Plot: <Lsp>minitr/ Lspmax @ XP=0 • Superpose regular minitrains on each other (excuding the long minitrain average Lsp (+/- stat) Bucket # (modulo 72) Bucket # (modulo 72) • Pacman & regular bunches show a different sensitivity to x angle • the e--angle dependence of Lsp is not primarily due to the Pacman bunches
Pacman bunches: parasitic crossings or phase transient ? W. Colocho Data: 1 Jul 04 • Plot Lsp/Lspmax @ XP=0 • green = 1st bunch • blue = last bunch (8 bunches/minitrain) • red = last bunch (9 bunches/minitrain) Bucket # Bucket # • 1st, 8th & 9th bunch react differently to e- x angle. Could this be because the impact of phase transients (zcoll offset) increases w/ Xing angle? • could there be orbit-dependent wakefields (& hence tune shifts) ??
Pacman bunches in the HER: gated-camera results D. Dujmic Data: 1 Jul 04
R. Holtzapple + A. Fisher Jul 04 “Pacman” effects (III): tune variation long the train From http://pepii-wienands1.slac.stanford.edu:8080/PEPmtg/Spring04/RLH_Gated_tun_15JLY04.pdf :
x z Y. Cai, W.K., I. Narsky, J. Seeman, M. Sullivan March - July 04 data Crossing-angle experiments • Goal: measure impact on beam-beam performance, of • horizontal crossing angle DXP • horizontal IP separation DX • Principle • scan horizontal IP angle (XP) or position (X) of e- beam • in the HER, no sextupoles within closed orbit bump • variation in XP-induced coupling should be small: scan range~ +- 1 mrad • separate optical & beam-beam effects • by comparing scans at low, intermediate & high bunch currents • using patterns without & with parasitic crossings (DXP DX @ PC) • at each beam current setting • keep collisions well-centered, other angles fixed (XP+, YP+, YP-) • optimize luminosity before scanning • record Lsp, LEB & HEB beam sizes, tranverse loss rates... DXP = 1 mrad x s =10 mm x 2sDX = 20 m
Crossing-angle experiments (I): X offset scan Sx = 152m .06 x .06 mA/b by-4 sxeff= 21m 1.54 x 0.92 mA/b by-2 (minitrains) No tune or optical adjustments during X-scans.
Simulations: I. Narsky Parameter set: 2003 X-dependence of luminosity & beam sizes • Low current: excellent agreement between data & simulation • High current: qualitative agreement between data & simulation • on Lsp out to DX ~ 40 m. At higher DX, simulation underestimates Lsp drop. on the HER y blowup but not on the other beam sizes! Specific luminosity and vertical HEB size vs.horizontal beam separation, at various e+ e-bunch currents,for data and simulation. At each current, the luminosity andspot size are normalized to their value at zero separation.The data are from a bunch pattern without parasitic crossings.No tune or other optical adjustments are carried outduring the scan.
+ x • DX @ parasitic crossings • XP(e-) more +ve DX (PC) • nominal: DX(PC) = 3.22 mm @ z = +/- 63 cm • XPmax(e-) = - 0.60 (+ 0.85) mrad DX 3.6 (2.7) mm Beam-beam sensitivity to parasitic crossings & Xing angle • Goal: measure the luminosity degradation associated with • parasitic crossings • horizontal crossing angle • Principle • by-2 pattern: compare Lsp at minimum, nominal & maximum parasitic-xing separation ( = e- x-angle) with full L optimization at each setting sensitivity to Xing angle + parasitic crossings • by-4 pattern: compare Lsp at minimum, 0, & maximum (achievable) Xing angles ( = e- x-angle) with full L optimization at each setting sensitivity to Xing angle only • HEB only: measure impact (if any) of e- x-angle on e- beam properties
Without parasitic Xings (by-4)Lsp exhibits a parabolic dependence on XP(e-) With parasitic Xings (by-2) the peak Lsp is ~ 5% lower (@ nominal PC separation) than in the by-4 pattern the larger XP(e-), the steeper the Lsp degradation The optimum e- x angle is ~ 0.2 mrad more -ve in the by-2 pattern ( weaker PC effects) This suggests that in the presence of parasitic Xings, the optimum e- angle is a compromise between Xing-angle & PC-inducedluminosity degradation Lsp dependence on Xing angle & PC separation: experimental summary
Simulations: Y. Cai Parm. set: 2003 Lsp dependence on Xing angle & DXPC: data vs. simulations
Y. Cai Parm. set: 2004 Combined effect of Xing angle & parasitic crossings • The simulation confirms that in the presence of parasitic crossings, introducing a small –ve Xing angle improves the luminosity • The optimum Xing angle is slightly larger in the simulation (-0.2 mrad) than in the data (-0.1 mrad) – consistent with the (previously) simulated Xing-angle dependence without PC’s • In the simulation, the best Lsp achieved with parasitic Xings is 3% larger than without PC’s; in the data, it is4% smallerwith PC’s.
Summary (I): luminosity performance • Luminosity parameters during Run 4 • The LER/HER current ratio rose from ~ 1.3 in the by-3 pattern to ~ 1.6 in the by-2. The LER bunch current rose from ~ 1.3 mA/b to ~ 1.5 mA/b; the HER bunch current remained constant around 0.90 +- 0.02mA/b. These should be compared to the target bunch currents at the end of Run 5: I+b = 1.92 mA/b, I-b = 1.05 mA/b, I+/ I- = 1.83 • The specific luminosity displays little global improvement over Run 4, and typically averages 3.8 - 3.9 1030 at high current. The peak in total luminosity ( > 9 1033) correlates with exeptionnally high Lsp (4.1 - 4.2 1030). • Progress in peak luminosity during Run 4 is dominated by increased numbers of bunches (hence larger total I), and higher LER bunch current. • The history of the LER & HER beam sizes (SLM / interferometer) shows a progressive decrease in LER x size, and increase in HER y size. Some of the single-beam spot sizes also exhibit significant drifts; whether these are instrumental, or reflect actual optics changes, is unknown. • The total luminosity scales like the total # bunches (@ constant Ibunch) • Pacman effects • Lsp at the edges of minitrains is ~ 10-20% lower than in the middle. • The Lsp degradation is sensitive to the location along the train, the minitrain length, and the e- angle (or the Xing angle?), with patterns suggestive of wakefield effects. Gated-camera & gated -tune measurements suggest the same.
Summary (II): beam-beam limits • Experimental charaterization • the luminosity/bunch exhibits moderate –albeit growing - saturation at the highest operational currents. The bunch currents appear mainly limited by transverse losses ( lifetime, beam-beam backgrounds) [+ RF, heating !] • the performance at run end is a smooth extrapolation from the Jan 04 scans, except for a reduction in LEB x/y blowup, and an increase in HEB y-blowup • the specific luminosity appears limited by • horizontal LEB blowup (40-45% wrt single e+ beam), and • vertical HEB blowup (60% wrt single e- beam). This is the controllling factor at the upper edge of the beam-current range. • Vertical LEB blowup is noticeable (10-15%), as is horizontal HEB blowupe (10-15%). • Beam-beam simulations of luminosity performance • The absolute agreement on Lsp is at the 15-20% level. The predicted blowup pattern is in qualitative agreement with the data; in particular, the large x-blowup at the LER SLM is now understood as the combination of dynamic band dynamic e . • But the current-dependence of Lsp & s’s is modelled qualitatively only. • Several improvements are needed • more reliable measurement of colliding tunes & IP beam sizes ( IP SLM model!) • updated input parameters: tunes, e, b*, sz • simulation of lattice non-linearities
Summary (III): Crossing-angle experiments • x-offset scans (DX) [no parasitic crossings, no L reoptimization] • The dependence of the specific luminosity Lsp on horizontal e+ - e- separation has been measured in a pattern without parasitic Xings. The DX fall-off of Lsp becomes steeper with increasing currents. • Beam-beam simulations are in qualitative agreement with the measurements. In particular, they highlight HEB vertical blowup as the primary cause of luminosity degradation for horizontally offset beams. • crossing-angle scans [no parasitic crossings, full L reoptimization] • Lsp exhibits a roughly parabolic dependence on the e- x-angle (after reoptimization @ each angle). • The dependence of the luminosity on the Xing angle is steeper in the data (6-7 % for a half crossing angle qc = 0.3 mrad) than in the simulation (3%). • parasitic crossings [by-2 pattern, full L reoptimization] • The peak specific luminosity is ~ 5% lower (@ nominal PC separation) than in the by-4 pattern, in agreement with the simulation; the more positive the e- x-angle, the steeper the additional luminosity degradation. • The optimum e- x-angle is ~ 200 mrad more negative (i.e. weaker PC effects) in the by-2 pattern, than in the by-4 pattern. Simulations confirm that in the presence of parasitic crossings, the optimum e- angle is a compromise between Xing-angle & PC-induced luminosity degradation. • Simulations predict a qc dependence of Lsp similar to that observed; but they also suggest that the PC-induced L degradation can be fully compensated.
A. Novokhatski “Pacman” effects (details) 3 Apr 04 1512 bunches 21 Mar 04 1415 bunches
Pacman bunches: phase transient ? Sparsified by-2 pattern, crossing-angle MD of 1 Jul 04
Pacman bunches in the HER: gated-camera results D. Dujmic Data: 1 Jul 04
X-dependence of specific luminosity Lowcurrent Excellent agreement between data & simulation Medium/ highcurrent Qualitative agreement betw. data & simulation on Lsp out to DX ~ 40 m (but: beam sizes!).Simulation underestimates Lsp drop