Download
1 / 16
160 likes | 274 Views
Introduction Shape Signatures 1 is a method for compactly encoding

E N D
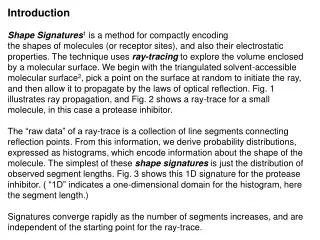
Introduction Shape Signatures1 is a method for compactly encoding the shapes of molecules (or receptor sites), and also their electrostatic properties. The technique uses ray-tracing to explore the volume enclosed by a molecular surface. We begin with the triangulated solvent-accessible molecular surface2, pick a point on the surface at random to initiate the ray, and then allow it to propagate by the laws of optical reflection. Fig. 1 illustrates ray propagation, and Fig. 2 shows a ray-trace for a small molecule, in this case a protease inhibitor. The “raw data” of a ray-trace is a collection of line segments connecting reflection points. From this information, we derive probability distributions, expressed as histograms, which encode information about the shape of the molecule. The simplest of these shape signatures is just the distribution of observed segment lengths. Fig. 3 shows this 1D signature for the protease inhibitor. ( “1D” indicates a one-dimensional domain for the histogram, here the segment length.) Signatures converge rapidly as the number of segments increases, and are independent of the starting point for the ray-trace.
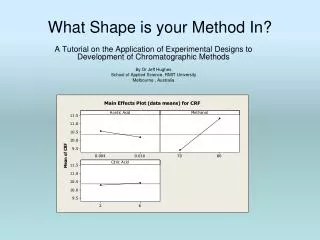
Fig. 1. Reflection from a single surface element. The normal vector to the surface bisects the reflection angle Fig. 2. Ray-traces for the HIV protease inhibitor indinavir, with 100 and 10,000 reflections. As the number of reflections increases, the volume of the molecule is densely filled with rays. l1 l2 Indinavir 10000 reflections 100 reflections
Fig. 3. 1D shape signature for Indinavir (Sulfurous acid) Fig. 4. Comparing signatures for two compounds. Here two small compounds with similar shape but very different connectivity are compared. D = 0.082 (Aziridine)
By computing the molecular electrostatic potential (MEP) at each reflection point, we can extend the signatures to include information about both shape and polarity. Fig. 5 shows a 2D-MEP signature for the protease inhibitor. Here the vertical axis represents the MEP measured at a reflection point, the horizontal axis the sum of the segment lengths on either side of a reflection, and the color coded distribution is the probability for simultaneously observing given values of these two parameters at a reflection point. (a) (b) Fig. 5. (a) MEP is computed at the reflection point between segments 1 and 2. (b) 2D-MEP signature for the HIV protease inhibitor indinavir.
Database Searching Shape Signatures are compared using simple metrics. One approach, shown in Fig. 4, is to merely take the sum of the differences between histogram heights, measured at corresponding “bins” in the domain. The smaller this distance between two signatures, the greater the similarity we expect to observe in the molecules the signatures represent. Our strategy is to “augment” a chemical database with shape signatures, and to then screen the database for compounds of interest by comparing the signature of a query compound against all the molecules in the library. While generating the signatures involves a significant computational expense, comparing them is computationally trivial, and the generation step need be done only once for a given database! As an initial test, we compared each compound in the Tripos3 small-molecule database against all the other compounds in the database using the simple 1-D signatures. This database is chemically diverse, containing amino acids, carbohydrates, heterocycles, fatty acids, etc. Fig. 6 illustrates the power of the method in discriminating among molecules on the basis of shape.
Fig. 6. Comparison of Tripos small molecule database against itself (selected results)
Application to Estrogenic Compounds It is now widely recognized that chemical compounds that can mimic the biological effects of sex hormones can pose significant hazards to the health of both humans and wildlife4. These endocrine disruptors include as a subset estrogenic compounds, which can interact with estrogen receptors. There is increasing interest in the problem of quickly screening large chemical libraries for potential estrogen mimics5. Ideally, it would be possible to rapidly and accurately scan a given database for molecules with a high proabability of acting as estrogen mimics; once identified, candidate compounds could be subject to further scrutiny, including assays of biological activity. A special problem is posed by the character of the estrogen receptor - it is promiscuous, interacting with compounds that feature no obvious structural similarity. It is our hypothesis that shape (and electrostatics) are better descriptors of estrogenicity than chemical structure. The shape signatures method is well-suited to searching chemical databases directly on the basis of shape and polarity.
Here we use shape signatures in “ligand-based” mode, scanning a large database for compounds similar in shape to known endocrine disruptors. Our target is a large subset (115,000 compounds) of the NCI Database6. Coordinates for the compounds in the NCI library are supplied by Tripos, Inc. as part of the UNITY chemical database package. Shape signatures information has been generated for all compounds in NCI with molecular weight less than 800. Computations were carried out using the Beowulf cluster at the West Center for Computer-Aided Drug Discovery at the University of the Sciences in Philadelphia. Queries Our queries are four compounds known to be endocrine disruptors: 17--estradiol, coumestrol, DES, and tamoxifen.A selection of the top hits for 1D signatures searches are presented in Figs. 7-10. (Hits were ranked on the basis of distance between target and query signatures.)
Fig. 7. Selected hits (from top 50), 17--estradiol as query, using 1D signatures Hit #7 Hit #1 Hit #4 (QUERY!) 16205-32-6 50-28-2 59452-14-1 Hit #15 Hit #11 QUERY 547-81-9 21513-89-3 17--estradiol Hit #35 Hit #36 Hit #24 1740-19-8 82571-86-6 2686-05-7
Fig. 8. Selected hits (from top 50), coumestrol as query, using 1D signatures Hit #2 (QUERY!) Hit #5 Hit #1 520-28-5 479-13-0 6316-25-2 Hit #12 Hit #7 QUERY 29980-70-9 73460-18-3 coumestrol Hit #24 Hit #31 Hit #15 23774-13-2 67199-66-0 14191-22-1
Fig. 9. Selected hits (from top 50), DES as query, using 1D signatures Hit #3 Hit #6 Hit #1 83456-29-5 3092-20-4 5465-75-8 Hit #12 Hit #10 QUERY 21323-24-0 6321-89-7 DES Hit #17 Hit #15 Hit #24 5455-89-0 6960-48-1 2878-63-9
Hit #19 Hit #14 316-07-4 6748-91-0 Fig. 10. Selected hits (from top 50), tamoxifen as query, using 1D signatures Hit #4 Hit #1 Hit #2 65321-78-0 19142-68-8 341-69-5 Hit #7 Hit #5 QUERY 85727-12-4 tamoxifen 66421-87-2 Hit #42 3733-63-9
Comments on 1D search: • If the query compound is present in the database, it is ranked close to the top, although it may not be the #1 hit. (Incomplete convergence of histograms? Sensitivity to conformation?) • Compounds larger than the query, but which share a common motif, can be selected (Fig. 7/Hit #24) - also “rearrangements” of the query (Fig. 8/Hit #1) • DES is present in the NCI database, but is NOT selected by the query. The structure in the Tripos-supplied version of NCI is incorrect, the phenol groups in cis arrangement about the central double bond, where they should be trans! • Compounds are selected which are shape-similar to the query, but have distinctly different connectivity (Fig. 7/Hit #36). • Shape signatures can effectively identify compounds on the basis of shape.
2D-MEP Searching Searches were carried out against the NCI database using 2D-MEP signatures, with the same set of query compounds. From our initial 1D search, it was clear that a hydroxyl on 17--estradiol was positioned with opposite orientation to the database hits, likewise for a hydroxyl on coumestrol. This makes little difference in the shape-only search, but is critical when electrostatics is included. These hydroxyl positions were modified prior to running the 2D search. Results for the 2D-MEP search clearly show the influence of electrostatics. This is most dramatically seen for 17--estradiol, and and to a lesser extent for coumestrol; the top seven hits for each of these queries are shown on in Fig. 11. Compounds identified by the 2D-MEP search are similar to the queries both in polarity and size. In each case, the query finds itself as best hit.
Fig. 11. Best hits for two 2D-MEP searches 17--estradiol: Hit #1 #2 #3 QUERY! 1630-83-7 1090-04-6 50-28-2 #5 #6 #4 #7 6301-88-8 19882-03-2 3597-38-4 6301-87-7 Coumestrol: QUERY! #2 Hit #1 #3 479-13-0 80784-88-9 55977-10-1 #5 #7 #4 #6 6780-38-7 6468-49-1 1690-63-7 54108-08-6
Conclusions Shape Signatures promises to be a powerful tool for identifying molecules on the basis of shape and polarity. In our initial tests using estrogenic compounds as queries, searching with 1D signatures casts a “wider net”, selecting from the database compounds that are are shape similar to the query in all or in part. Searching with 2D-MEP signatures would appear to yield tighter selectivity, the result of screening on the basis of both shape and electrostatic potential. References 1. R. Zauhar, J. Fretz & W. Welsh, Shape signatures, a novel technique for ligand- and receptor-based molecular design, in preparation 2. SMART: A Solvent-Accessible Triangulated Surface Generator for Molecular Graphics and Boundary Element Applications, R.J. Zauhar, J. Comp-Aided Mol. Design., 9, 149-159 (1995). 3. Tripos, Inc., 1699 South Hanley Road, Saint Louis, MO 4. Kavlock, R.J.; Daston, G.P.; DeRosa, C.; Fenner-Crisp, P.; Gray, L.E.; Kaattari, S.; Lucier, G.; Luster, M.; Mac, M.J.; Maczka, C.; Miller, R.; Moore, J.; Rolland, R.; Scott, G.; Sheehan, D.M.; Sinks, T.; Tilson, H.A. Research needs for the risk assessment of health and environmental effects of endocrine disruptors: A report of the U.S. EPA-sponsored workshop. Environ. Health. Perspect. 1996, 104, 715-740. 5. Patlak, M. A testing deadline for endocrine disrupters. Environm. Sci. Technol. 1996, 30, 540A-544A. 6. NCI Database, Developmental Therapeutics Program, National Cancer Institute, National Institutes of Health, Bethesda, MD.