Download
1 / 61
610 likes | 741 Views
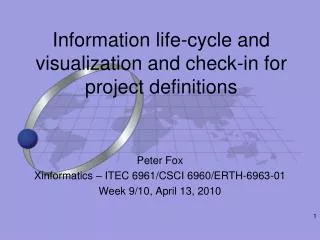
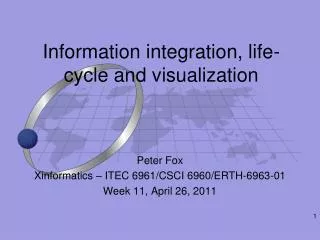
Information integration, life-cycle and visualization. Peter Fox Xinformatics 4400/6400 – Week 6, March 4, 2014. Contents. Review of last class, reading Information integration Information life-cycle Information visualization Projects? Next…. Information integration.

E N D
Information integration, life-cycle and visualization Peter Fox Xinformatics 4400/6400 – Week 6, March 4, 2014
Contents • Review of last class, reading • Information integration • Information life-cycle • Information visualization • Projects? • Next…
Information integration • Involves combining information residing in different sources and providing users with a unified view of them. • This process becomes significant in a variety of situations both commercial (e.g. when two similar companies need to merge their databases) and scientific (e.g. combining research results from different bioinformatics repositories). • Integration appears with increasing frequency as the volume and the need to share existing information explodes.
Information integration • It has become the focus of extensive theoretical work, and numerous open problems remain unsolved. • In management circles, people frequently refer to data integration as "Enterprise Information Integration" (EII)” wikipedia • Is this an information management challenge (rhetorical question)? • Integration discussion context • Data Integration vs. Data Interoperability
An example - Geospatial • Much of the work on information integration has focused on the dynamic integration of structured data sources, such as databases or XML data. • With the more complex geospatial data types, such as imagery, maps, and vector data, researchers have focused on the integration of specific types of information, such as placing points or vectors on maps, but much of this integration is only partially automated. • The challenge is that the dynamic integration of online data and geospatial data is beyond the state of the art of existing integration systems.
Geospatial • The conflation process divides into following tasks: (1) find a set of conjugate point pairs, termed "control point pairs", in both vector and image datasets, (2) filter control point pairs, and (3) utilize algorithms, such as triangulation and rubber-sheeting, to align the rest of the points and lines in two datasets using the control point pairs. • Typically by human input has been essential to find control point pairs and/or filter control points
Courtesy Jim Barrett Value Chain –data.gov – Integration Context Use Side Community of Users Supply Side Community of Suppliers Acquire Data Build Dataset Publish Dataset Enable Discovery Discover Connect Participate Enable Use Data.gov Supply Chain Management – no geo integration focus Access and Interoperability Focused
Courtesy Jim Barrett Data and Information Quality • Temporal – currentness, vintage… • Semantic – meaning of the object and its attributes • Spatial dimensions (X,Y,Z) • Accuracy (positional) • Topology/modeling • Resolution • Representation All important qualities – how we attain them will require not only technology but improvement to how we manage Typical Spatial Integration
Courtesy Jim Barrett What do users need know to about obtaining geospatial data?
Courtesy Jim Barrett Who produces the information I need? Are they “the” recognized authority? How can I tell? How often will it be re-published? • Is the supply predictable and reliable? Can I count on it? Do the data have a geospatial characteristic? • What are its geospatial qualities (specs) and provenance? • Is it consistently defined in its meaning? • What is the scope of its coverage? Will the data be maintained? • Geometry and models • Attributes and metadata Where do I get it and in what forms? Simple supply side questions that are very hard to answer?
Courtesy Jim Barrett They should not have to ask if it has been integrated?
Courtesy Jim Barrett What is stopping us from answering these basic questions?
Courtesy Jim Barrett What is preventing our information from being integrated? • Acquisition: • Uncoordinated acquisition strategies at national level • Barrier between business data and geospatial data i.e. schools, minerals, • Few means to broker and optimize requirements from consumers • Production • Quality of our metadata and when and how we get it • Unclear operational roles in a national data framework. (NSDI) • Absence of a granular or meaningful trustworthy chain of authority? • Absence of a schedule to communicate what is going to be happening? Barriers to integration
Courtesy Jim Barrett Where are the problems occurring in the Value Chain? Supply Side Community of Suppliers Use Side Community of Users Ambiguous Cataloging and semantics Gap in what gets integrated Acquire Data Build / Intra Dataset Integration Publish Dataset Enable Discovery Discover Connect Participate Enable Use Downstream Integration $$$ Gap in planning view of Acquisition Data.gov Supply Chain Management Data Integration Focused Access and Interoperability Focused
Courtesy Jim Barrett What we have is many value chains running in parallel. It is hard to do integration without a systematic collaborative approach.
Courtesy Jim Barrett We resemble this!
Courtesy Jim Barrett We need to integrate the supply chain.How can we think about the problem differently?
Courtesy Jim Barrett A supply chain is a system of organizations, people, technology, activities, information and resources involved in moving a product or service from supplier to customer. Supply chain activities transform natural resources, raw materials and components into a finished product that is delivered to the end customer. In our case Information. In sophisticated supply chain systems, used products may re-enter the supply chain at any point where residual value is recyclable. Supply chains link value chains Organizing Principles
Courtesy Jim Barrett Supply Chain Reference Model
Courtesy Jim Barrett Value Chain –data.gov – Integration Context Use Side Community of Users Supply Side Community of Suppliers Acquire Data Build Dataset Publish Dataset Enable Discovery Discover Connect Participate Enable Use Data.gov Supply Chain Management – no geo integration focus Access and Interoperability Focused
Courtesy Jim Barrett Why we need to think differently!
Courtesy Jim Barrett Architect and Design towards integration!
Courtesy Jim Barrett Indonesian NSDI
Recall elements/ forms of information • Structured/ un-structured, content, context • Presentation and organization • Syntax-semantics-pragmatics • Managed, designed and architected.
Recall elements/ forms of information • Integration poses an important challenge here • Two forms presented/ organized differently • Different structure, semantics… • Information back to data back to information
Aiding integration • Usually an integration capability is HIGHLY curated or left entirely to the end user • If left to the user, the results is a new product which must also be managed and shared • “I can’t integrate what I don’t understand” • Key idea: provide for integratability !!! • Standards – formats for sure but also • Metadata • Semantics
Different contexts? • Relies especially on structural/ use metadata • Provide different means/mode for integration • E.g. geospatial, uses … well ‘space’, really surfaces (latitude, longitude) • Geological data integration uses time and feature (of interest) – why? Yes, things move • Atmospheric science, e.g. chemistry or structure of the atmosphere may use ‘layers’ or pressure as an indicator for position • Comparing in-situ with remotely sensed information in many fields, e.g. medicine
Informatics considerations • Be aware of what means for integration is and can be used • This is more than often what leads to new findings, and abductive reasoning… one of our goals
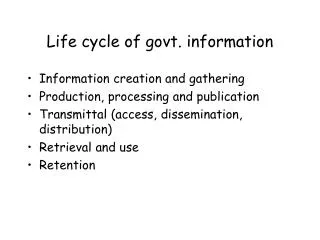
Life cycle - definitions • Life-cycle elements • Acquisition: Process of recording or generating a concrete artefact from the concept (see transduction) • Curation: The activity of managing the use of data from its point of creation to ensure it is available for discovery and re-use in the future (http://www.dcc.ac.uk/FAQs/data-curator) • Preservation: Process of retaining usability of data in some source form for intended and unintended use • Stewardship: Process of maintaining integrity across acquisition, curation and preservation
Definitions ctd. • Management: Process of arranging for discovery, access and use of data, information and all related elements. Also oversees or effects control of processes for acquisition, curation, preservation and stewardship. Involves fiscal and intellectual responsibility.
The nature of the challenge • To architect information systems today • You may play many roles • You may not get all the metadata or information you need even if you get the data • You will need skills that you were not taught • To work with end-users today • You may have lots of technical experience • You will need new skills in addressing the changing use of data and information • One ‘size’ does not fit all
Acquisition • Learn / read what you can about the means of acquisition • Documents may not be easy to find • Bias in everywhere!!! • Document things as you go (I know you hate it, but please get over that)
Curation • From producer to consumer! • Consider the organization and presentation of the data as information • Design factors to reduce uncertainty • Making use of semiotics – you should know how! • Document what has been (and not) done • Look to add metainformation
Preservation • ‘Archiving’ is only one component • Intent is that ‘you can open it any time in the future’ and that ‘it will be there’ • Where are your class notes from last term? • This term? • This involves steps that may not be conventionally thought of • Think 10, 20, 50, 200 years…. looking historically gives some guide to future considerations
Remember • The life cycle applies within and before and after your use case… • So, let’s look at one in a little more detail
How the information is created • Systemic • Environmental • Trial-and-error (or ad-hoc)
How is information delivered? • White paper (a document) • Web site FAQ • Web site informational • Web site directed (link sent with e-mail, and so on) to a specific Web site • Application-based delivery via managed expert system • One-to-one presentation: • Word of mouth • Ad-hoc communication
How the information is managed • Complexity of the information • Complexity of the creation process • Complexity of the management system Complexity=Uncertainty? • Financial impact of creation
Type of information created • Tacit (created and stored informally): • Human memory • Localize, e.g. hard drive of the computer • Movement of tacit information into a formalized structure • Explicit (created and sorted formally): • Network shared • Network Web site/intranet • Informal knowledge-management system • Document-management system • Formal KM system
For information creation: • Consider the • Value of the source • Age of the information • Proximity of the information to the consumer • Source of the information, and previous interactions with that specific source • Means for Re-creation??
Value of the source • Age of the information • Proximity of the information to the consumer • Source of the information, and previous interactions with that specific source
Life cycle is a complex issue • Must be managed • Documented • As part of the use case, but also often outside it
Next • Visualize whirled peas
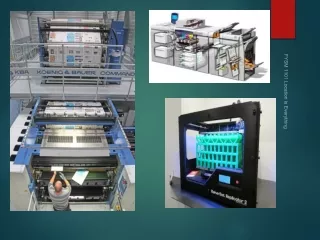
Information Visualization • Defn: "to form a mental vision, image, or picture of (something not visible or present to sight, or of an abstraction); to make visible to the mind or imagination" [The Oxford English Dictionary, 1989] • Direct link to cognition and mental representation • Semiotics (again)
Why visualization? • Reducing amount of data, quantization • Patterns • Features • Events • Trends • Irregularities • Exit points for analysis
Types of visualization • Color coding (including false color) – color theory from last week • Classification of techniques is based on • Dimensionality • Information being sought, i.e. purpose (design) • Line plots • Contours • Surface rendering techniques • Volume rendering techniques • Animation techniques • Non-realistic, including ‘cartoon/ artist’ style
Visualization formats • Many – vector, raster (image), animation, multi-dimensional,
However, information cf. data.. • Think back to your presentations on semiotics and the visual representations of information systems – both good and bad • Not just a matter of the ‘producer’ view… consider the ‘consumer’ view, i.e. what is the goal of the visualization? • This is a time when • Experience helps a lot • But so does listening and gaining external feedback