Download
1 / 17
170 likes | 262 Views
Improving Scottish Local Government Benchmarking In Scotland Public Services Reform Inquiry: Strand 2 – Benchmarking & Performance Measurement Scottish Parliament 10/09/12. Ronnie Hinds & Mark McAteer. SOLACE/ IS Benchmarking Project. Purpose

E N D
Improving Scottish Local Government Benchmarking In ScotlandPublic Services Reform Inquiry: Strand 2 – Benchmarking & Performance MeasurementScottish Parliament 10/09/12 Ronnie Hinds & Mark McAteer
SOLACE/ IS Benchmarking Project Purpose To support SOLACE (Scotland) to drive improvement in LG benchmarking To develop a comparative performance support framework for Scottish LG To support councils in targeting transformational/ change resources to areas of greatest impact – efficiency (costs)/ productivity/ outcomes Focus on ‘Big ticket’ areas of spend plus corporate services
SOLACE/ IS Benchmarking Project • Operating Principles • Consensus – agreement by all councils • Can openers – raise issues/ focus attention on differences & to support councils to collaborate in exploring reasons behind differences • Comparability – similar councils/ services on key performance criteria
SOLACE/ IS Benchmarking Project • The Starting Point • Project initiated summer 2010 • Develop service grouping for managing the analysis – Children’s Services; Corporate Services; Social Work; Culture & Leisure: Environmental; Housing; Corporate Asset Management • Indicator criteria: comparable across councils/ services; materially help improve performance • Sub criteria: • - relevant - unambiguous - timely data • - accessible - consistent - cost effective to collect • - statistically robust
SOLACE/ IS Benchmarking Project • The Outputs • 47 indicators where data is available, reliable & consistent – 8 indicators require further development work • Focus on cost/ outputs/ customer satisfaction • - Children’s Services • - Corporate Services • - Social Work • - Culture and Leisure Services • - Environmental Services • - Housing • - Corporate: Assets & Property
SOLACE/ IS Benchmarking Project • Data • 2010/ 11 base year with 3 years previous data (07/08 – 09/10) to support interpretation; cash & real term changes; Scottish mean & median figures • Local Financial Return (LFR) core data component plus other ‘quality’/ performance data sources e.g. Statutory Performance Indicators • Service support costs key area of data weakness - corporate & service based support costs; corporate services (assets & ICT)
SOLACE/ IS Benchmarking • ‘Family’ groupings • Need to get beyond data - ‘like for like’ comparisons • Examined existing methodologies – CIPFA; Education Scotland; Welsh LG Data Unit • Categories & - socio economic: population: education: • variables housing: social care
SOLACE/ IS Benchmarking Project • Data Analysis/ Interpretation/ Improvement • Avoiding simplistic league tables – sensitivities to media/ public reading of information • Developing a common interpretive process & data standardisation • Data in the round - ensuring performance/ finance/ service links; unpicking cost & ‘outcome’ performance relationships • Situating analytical issues – small area profiling; internal & external interpretation • Links to performance improvement activities – e.g. PSIF
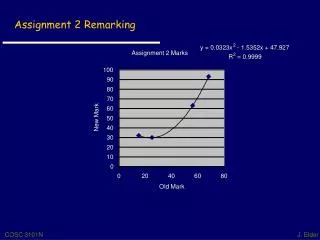
Median Figure Goes from £6,491 to £6,388 (-£103) Range Goes from £5,549 to £7,770 (£2221) Education: Spend Per Secondary Pupil (Minus Outliers)
Education: Spend Per Secondary Pupil & Standard Grades (All)
Also results in minor shift in median performance as well as median spend Education: Spend Per Secondary Pupil & Standard Grades (Minus Outliers)
High performance/ below median spend Lower performance/ above median spend Education: Spend Per Secondary Pupil & Standard Grades (Minus Outliers)
Above median performance Gap to medium smaller than might have anticipated Education: Spend Per Secondary Pupil & Standard Grades & 15% SIMD (All)
Similar social structures at council level but differences in performance Education: Spend Per Secondary Pupil & Standard Grades & 15% SIMD (All)
But Need to Understand • Snap shot data • Factors of production – CPP costs; staff structure; size of schools..... • Socio economics of local communities– need to understand more about how it impacts • Aggregate council data – need to get below council level to truly understand what is happening • Getting supporting narrative right - making sense of complexity
SOLACE/ IS Benchmarking Project • Issues & Reflections • Data: strong on inputs & outputs; improve outcome data; time lag • Public service reform – disaggregated data; link to outcomes; evidence led service delivery options; setting priorities; benchmarking across partnerships • Engaging & informing the customer – are they interested; what can they do? • Role for national government: data improvement; de-cluttering landscape • Role for local government: self assessment & improvement; mutual learning; self discipline; confidence building – getting system & culture right