Download
1 / 15
150 likes | 325 Views
Performance Study of a SMPP Traffic Generator Tool. Kai Wu Nokia NMP/MSW Supervisor: professor Jorma Virtamo. Agenda. Background SMPP Traffic Generator Software Performance Evaluation Traffic Generator Performance Measurements Traffic Generator Performance Optimizations

E N D
Performance Study of a SMPP Traffic Generator Tool Kai Wu Nokia NMP/MSW Supervisor: professor Jorma Virtamo
Agenda • Background • SMPP Traffic Generator • Software Performance Evaluation • Traffic Generator Performance Measurements • Traffic Generator Performance Optimizations • Summary and Conclusions
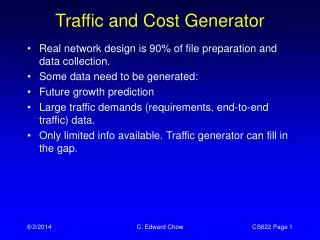
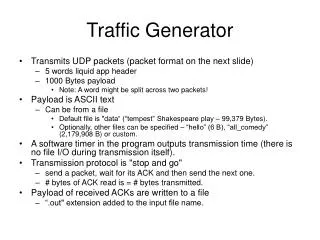
Background • SMS success and its exponential growth • Worldwide over 15 billion SMS messages were sent per month by December 2000 • SMS provides a bearer for data services • Currently about 10% of messaging is related to Internet based applications,for example,operator logos or ringing tones. • The demand for Internet based applications is growing fast alongwith development of new bearers such as GPRS and the development of WAP. • Multimedia Messaging will be in great demand soon. • Better capacity and stability are required on SMSC or MMSC • To accomandate the high volume messaging traffc . • Messaging traffic becomes especially peaky by the introduce of Push technology. • Traffic generator tests the capacity and stability • Traffic generator simulates the messaging traffic • Traffic generator itself must be capable of generating high rate traffic and keeps the rate accurate.
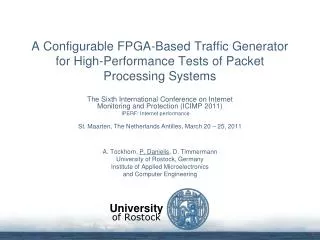
EAI Protocol Stack SMPP/UCP/CIMD2 TCP/IP or X.25 SMPP Traffic Generator • Diagram for operation of External Short Message Entities • ESME : External Short Message Entities • SMSC : Short Message Service Center • EAI: External Application Interface
SMPP • SMPP : Short Message Peer to Peer • SMPP is an open message-transfer protocol that enables non-mobile External Short Message Entities (ESME) to interface with an SMSC. SMPP is one of the industry standard protocols on EAI. • Using the SMPP protocol, a SMS application may initiate an application layer connection with an SMSC over a TCP/IP or X.25 network connection and may then send short messages and receive short messages to and from the SMSC respectively.
SMPP Traffic Generator • The traffic generator is functionally an ESME which uses SMPP protocol to receive and send short messages to the SMSC. • What ‘s more, it should be able to utilize efficiently the limited computing power, to generate as high rate traffic as possible. Additionally, the traffic rate should be made accurate. Thus the SMSC’s capacity could be measured and its stability be monitored. • SMPP traffic generator is a Unix flavored software written in Perl.Generally, Perl code is known to be from 2 to as much as 50 times slower than C code, usually in the 5-10 range on average. • language performance is not our concern. More attention is made in searching the application’s performance bottleneck, and in optimizing its implementations or structures.
Traffic Generator Essence • Single threaded Loop • Rate control by • ajusting sending interval • Looping rate determines • maximum sending rate
Question 1: • What are the performance targets under study? ( performance metrics ) • Maximum generating speed • Generating rate accuracy • Question 2: • How to give quantitative values to the interested performance targets ? • ( study approaches ) • Analytical modeling • Simulation • Measurement Software Performance Evaluation • Defination - Performance evaluation can be defined as assigning quantitative values to the indices of the performance of the system under study [Lei1997].
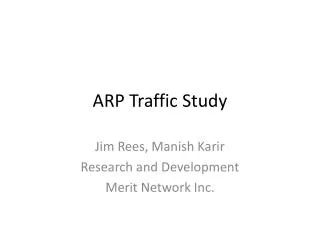
Profiler: tells which parts of the program take the most time to execute Logger: records the time stamps inserted for certain events interested Dummy Server: eleminates slow response problem limiting the rate Top: traces system resource consumptions like CPU and memory Traffic Generator Performance Measurement • Measurementsare to find information of interest, which can be used later to improve the performance. • Measurements are carried out by the use of various tools/utilities/monitors
Profiler Traffic Generator Dummy Server Logger TOP Measurement Scenarios List the most time consuming subcomponents Trace the system resource consumptions Record timing information like looping rate
Performance measurement not only tells the performance metric’s values, it also identifies the performance bottlenecks and checks the subtle performance flaws. The ultimate target for the performance measurement is to achieve a performance improvement. Measurement Results • Profiler lists the most time consuming subcomponents for each traffic scenario. • Logger records the current maximum looping rate. • TOP utility monitors the system resource consumptions • A delay error is observed for each traffic generating scenario, the generating rate is not accurate.
Performance Optimizations • Sometimes a very costly modification might prove to be insignificant to the overall performance. Therefore we should focus on the modifications which make the most effective improvement . • Profiler helps identifying the most time consuming subcomponents. • Different strategies and priorities were given to different improvement targets, considering the potential cost. • The optimization solution should consume ignorable extra system resources. • The optimization solution should avoid the delimma where one performance metric is improved, whereras the other is worsened.
Delay Error • In this approach, the time is assumed continuous. The looping time is • assumed infinitely small,but it is not infinitely small. • Error accumulates.
Delay Error Solution • In this case, as it is scheduling the next sending moment, • we add this offset value to the sending interval for a relatively delayed scheduling. • The offset in the second case has a negative value. So the next sending moment • is actually taken advanced to make up the delay. • We can guess the current looping time interval from the previous one.
Summary and Conclusions • The clarified performance metrics and the well planned measurements result in efficient optimization solutions. • By the improvement and the measurement validation, it is found that the maximum generating speed is improved by 40% • The generating rate accuracy flaws are solved. • All the improvements are made with minimum effort and costs, and the improved traffic generator consumes ignorable extra system resources.