Download
1 / 16
170 likes | 651 Views
Mode. Relationship b/w Mean , Median , Mode. Group Members Nisar Akbar Rana S aad Faheem Abbass Umar R iaz Umair S aleem Ahmed Bilal. What is Mode?.

E N D
Mode Relationship b/w Mean , Median , Mode
Group Members Nisar Akbar RanaSaad FaheemAbbass UmarRiaz UmairSaleem Ahmed Bilal
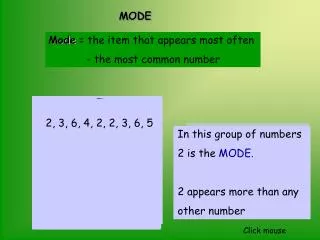
What is Mode? Modeis a French word that means fashion-an item that is most popular or common . In statistics ,the mode represent s the most common value in a data set. Def: “The mode is the value that occurs with the highest frequency in a data set.” It is represented by Mo.
Mode Of Ungrouped Data First place the numbers in value order then count how many of each number. The Mode is the number which appears most often .
QUESTION 1 The ages of 10 randomly selected students from a class are 21,19,27,22,29,19,25,23,15 and 18 years , respectively . Find the mode. Solution: 15,18,19,19,21,22,23,25,27,29 The mode of this data set is 19 because 19 has come two times which is highest frequency than other data members. Mo=19
Unimodal data set: A data set with only one value occuring with the highest frequency has only one mode . The data set in this case is called unimodal. Bimodal data set: A data set with two values that occurs with the same (highest) frequency has two modes . The distribution in this case, is said to be bimodal. Multimodal data set: If more than two values in a data set occurs with the same (highest) frequency, then the data set contains more than two modes and it is said to be multimodal.
QUESTION 2 The eye’s colors of 8 friends are, blue , green , blue , black , black , green , blue , black respectively. Find the mode. Solution: green, green ,black ,black ,black ,blue ,blue ,blue In the given data set , each of the two data members blue and black have highest frequency . Therefore , that data set has two modes. Mo= blue , black
QUESTION 3 The prices (in lacs) of eleven houses selected from all houses sold last month in a city are 96,55,35,77,96,53,35,66,86,29,77. Find the mode. Solution: 29,35,35,53,55,66,77,77,86,96,96 In the given data set , 35,77 and 96 have highest and equal frequency than other data members. Therefore , it have three modes 35,77 and 96. Mo=35,77,96
Mode Of Grouped Data Mode of Grouped data is calculated by the following formula: (fm – fm-1) Mode= L+ x w (fm – fm-1) + (fm – fm+1) where: L is the lower class boundary of the modal group fm-1 is the frequency of the group before the modal group fm is the frequency of the modal group fm+1 is the frequency of the group after the modal group w is the group width
QUESTION 4 The following table shows the number of hours per day of watching TV in a sample of 500 people: Find the length of time that is most often spent in front of a TV for this group (mode).
Solution: Modal Group = 4-5 L = 4 fm-1 = 87 fm = 145 fm+1 = 90 w = 2 145-87 Mo= 11 + X 2 (145-87)(145+90) Mo= 4.4
Advantages and disadvantages of mode Advantages: 1) It is easy to understand and simple to calculate. 2) It is not affected by extreme large or small value. 3) It can be useful for qualitative data. 4) It can be located graphically. Disadvatages: 1) It is not well defined. 2) It is not based on all the values. 3) Sometimes, the data having one or more than one mode and sometimes the data having no mode at all.
Relationship Among the Mean, Median, and Mode Now we describes the relationships among the mean, median, and mode for three histograms and frequency distribution curves. Knowing the values of the mean, median, and mode can give us some idea about the shape of frequency distribution curve.
1. For a symmetric bar graph with one peak , the values of the mean, median, and mode are identical, and the lie at the center of the distribution. Frequency Variable Mean=Median=Mode
2. For a bar graph skewed to the right , the value of the mean is the largest , that of the mode is the smallest, and the value of median lies between these two.The value of the mean is the largest in this case because it is sensitive to outliers that occure in the right tail. These outlier pull the mean to the right. Frequency
3. If bar graph are skewed to the left, the value of the mean is the smallest and that of the mode is the largest, with the value of the median lying between these two. In this case, the outliers in the left tail pull the mean to the left. Frequency