Download
1 / 21
210 likes | 277 Views
Building Accurate Pro-Formas. There is A LOT of information that is required to value a company Growth estimates Projected ratio and assumptions. Growth. Value of the firm = PV (Assets in Place) + PV (Growth Opportunities)

E N D
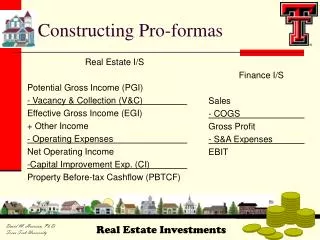
Building Accurate Pro-Formas • There is A LOT of information that is required to value a company • Growth estimates • Projected ratio and assumptions F409 - Projections
Growth • Value of the firm = PV (Assets in Place) + PV (Growth Opportunities) • High growth firms have a greater percentage of their value in growth opportunities. where, PVGO = Present Value of Growth Opportunities F409 - Projections
Sales Growth • Two types of growth • Stable growth (grow at one rate forever) • Large firms growing at steady rate often close to economy • Possibly Constrained by regulation • Characteristics of stable firm (average risk and average to low reinvestment rate) • Use in Terminal Value • Two-Stage growth • Smaller high growth firm • Moderate to high risk and moderate reinvestment rate (1-dividend payout rate) F409 - Projections
Factors impacting Growth Estimates • Historical Growth • How has firm grown in the past – high or low growth? • Is growth slowing down or speeding up? • Economic Analysis - • Does the firm grow more when the economy is doing well? • Does the firm grow less when the economy is doing well? • Is the firm’s historical growth unrelated to the ecomomy? • Industry Analysis • Is the industry growing or is any firm growth due to stealing market share? • What is the firm’s market share? What is the maximum market share the firm can hope to acheive.? F409 - Projections
Inflation Adjustments • Analyze real growth in sales (fisher equation) • Analyze real (in constant dollars) sales • Inflation adjustments using the Consumer Price Index • Be careful of corporate events such as mergers and divestitures F409 - Projections
Different Cycles of Growth • Microsoft • Higher growth • Growth increasing at a decreasing rate (sales is increasing at an increasing rate) • Exponential growth cycle • Y=emx+b • See graph • GE • More stable growth • Linear growth cycle • Y=mx+b • See graph F409 - Projections
How does the firm fund growth and Feasible Growth Rates • How do firms finance growth? • Internally –cash flow • Issue Equity • Borrow • High growth firms typically have low payout ratios (or very high reinvestment rates (1-payout). • Payout ratio = total dividends paid / net income • High growth firms retain income to invest in new projects. F409 - Projections
Feasible Growth • Sustainable growth = Maximum growth feasible without external equity financing and a constant debt to equity ratio • Internal growth = Maximum growth feasible with no external financing F409 - Projections
Hewlett Packard Feasible Growth • HWP has ROE of 0.174 and ROA of 0.087 in 1998. It paid out 21.2% of earnings as a dividend. Thus, its retention ratio nis 78.8% • Sustainable growth • HWP can grow at 15.9% without issuing equity and maintaining its current debt to equity ratio (i.e. will replace repaid debt and can have new borrowings as it retains earnings.) • Internal growth • HWP can grow at only 7.4% with no additional external financing F409 - Projections
Analyzing Firm’s Environment • Economic Indicators • Aggregate level of macroeconomic activity • GNP: the value of all goods and services produced using resources owned by a nation. • GDP: The value of products produced domestically. • Index of leading economic indicators • Produced monthly by Bureau of Economic Analysis of the Department of Commerce. • Averages 11 leading indicators such as: • New orders for consumer goods • S&P 500 • Leads by about ½ a year • Consecutive changes more informative • Predictions of economists for future economic trends. • Published monthly by Blue Chip Economic Indicators. • Project growth in GDP and changes in unemployment over 2 years. • Project inflation F409 - Projections
Sources for Firm and Economic Data • Bureau of Economic Analysis • http://www.bea.doc.gov/ • Federal Reserve Bank of Saint Louis • http://www.stls.frb.org/fred/ • Virtual Library of Finance Data on Web • http://www.cob.ohio-state.edu/~fin/osudata.htm F409 - Projections
Regression Analysis • How correlated is sales with the economy? • Compare sales growth and GDP growth • Simple regression analysis • Intercept and slope • What portion of the sales growth is explained by growth in GDP? • R squared between 30% and 60% • Does growth in GDP significantly explain sales growth? • P-value less than 0.10 • What is predicted sales growth? • Intercept + (Coefficient x Expected growth in GDP) • Hewlett Packard Example F409 - Projections
Regression Analysis • HWP and GDP Data F409 - Projections
Regression Analysis • Regression: y=mx+b, y=HWP growth and x=GDP growth • In Excel:Tools, Data Analysis, Regression F409 - Projections
Industry Analysis • What is the growth in the industry? • Does the firm have growth greater or lower than the industry? • If greater, then gaining market share • If smaller, then losing market share. • What market share do you expect the firm to have at stabilization? • This analysis will be essential when you analyze high growth firms with negative income because we will work backwards to do projections. F409 - Projections
Projecting Sales • Once you determine the growth rate, you project sales. • First and most critical step in pro-formas. • Much of other projected items come from this estimate because Sales drives the firm. • You will have greater costs of good sold and SG&A if you have more sales. • You will have more Accounts Receivable if you have more sales. • You will need more fixed assets if you have more sales. F409 - Projections