Download
1 / 14
230 likes | 603 Views
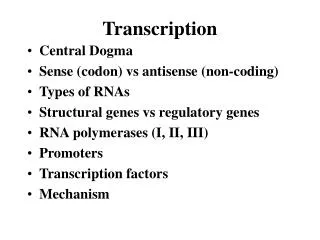
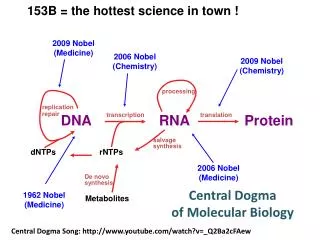
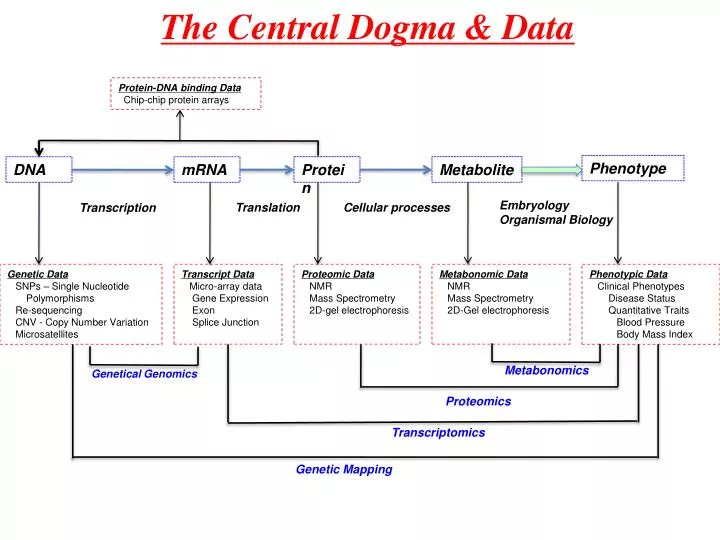
The Central Dogma & Data. Protein-DNA binding Data Chip-chip protein arrays. Phenotype. Protein. Metabolite. DNA. mRNA. Embryology Organismal Biology. Translation. Cellular processes. Transcription. Genetic Data SNPs – Single Nucleotide Polymorphisms Re-sequencing

E N D
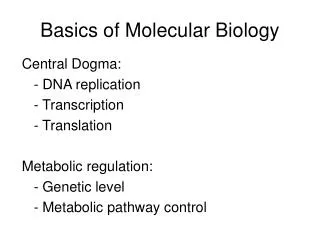
The Central Dogma & Data Protein-DNA binding Data Chip-chip protein arrays Phenotype Protein Metabolite DNA mRNA Embryology Organismal Biology Translation Cellular processes Transcription Genetic Data SNPs – Single Nucleotide Polymorphisms Re-sequencing CNV - Copy Number Variation Microsatellites Transcript Data Micro-array data Gene Expression Exon Splice Junction Proteomic Data NMR Mass Spectrometry 2D-gel electrophoresis Metabonomic Data NMR Mass Spectrometry 2D-Gel electrophoresis Phenotypic Data Clinical Phenotypes Disease Status Quantitative Traits Blood Pressure Body Mass Index Metabonomics Genetical Genomics Proteomics Transcriptomics Genetic Mapping
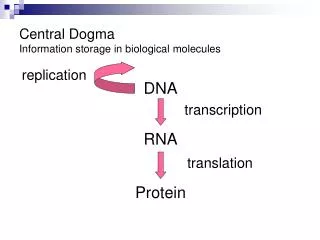
Structure of Integrative Genomics Classes Protein Metabolite DNA mRNA Phenotype Concepts Parts GF Mapping Physical models: Models: Networks Phenomenological models: Hidden Structures/ Processes Unobservered/able Knowledge: Externally Derived Constraints on which Models are acceptable Evolution: Cells in Ontogeny Individuals/Sequences in a Population Species Model Selection Data + Models + Inference Analysis: Functional Explanation
G: Genomes A diploid genome: Key challenge: Making a single molecule observable!! Classical Solution (70s): Many De Novo Sequencing: Halted extensions or degradation extension degradation 80s: From one to many: PCR – Polymerase Chain Reaction 00s: Re-sequencing: Hybridisation to complete genomes Future Solution: One is enough!! Observing the behavior of the polymerase Passing DNA through millipores registering changes in current
G: Assembly and Hybridisation Target genome 3*109 bp (unobservable) Reads 3-400 bp (observable) Contigs Sufficient overlap allows concatenation Contigs and Contig Sizes as function of Genome Size (G), Read Size (L) and overlap (Ø): Lander & Waterman, 1988 Statistical Analysis of Random Clone Fingerprinting {A,C} Complementary or almost complementary strings allow interrogation. probe {T,G}
T - Transcriptomics Measures transcript levels averaging of a set of cells.
P – Proteomics, M – Metabonomics & F - Phenomics P uses Mass Spectrometry and 2D gel electrophoresis of degraded peptides and Protein Arrays using immuno-recognition of complete proteins M uses Mass Spectrometry and 2D gel electrophoresis of metabolites F: The set of all phenotypes. Hard to define Focus on Clinical Traits Behavioural Traits hard to observe
Concepts Physical models: GF Mapping Models: Networks Phenomenological models: Unobservered/able Hidden Structures/ Processes Knowledge: Externally Derived Constraints on which Models are acceptable Cells in Ontogeny Individuals/Sequences in a Population Species Evolution:
GF • Mechanistically predicting relationships between different data types is very difficult • Empirical mappings are important • Functions from Genome to Phenotype stands out in importance • G is the most abundant data form - heritable and precise. F is of greatest interest. Phenotype Protein Metabolite DNA mRNA “Zero”-knowledge mapping: dominance, recessive, interactions, penetrance, QTL,. Mapping with knowledge: weighting interactions according to co-occurence in pathways. Model based mapping: genomesystemphenotype Height Weight Disease status Intelligence ………. Environment
The General Problem is Enormous Set of Genotypes: 1 3* 107 • Diploid Genome • In 1 individual, 3* 107 positions could segregate. • In the complete human population 5*108 might segregate. • Thus there could be 2500.000.00 possible genotypes Partial Solution: Only consider functions dependent on few positions • Causative for the trait Classical Definitions: • Single Locus Dominance Recessive Additive Heterotic • Multiple Loci Epistasis: The effect of one locus depends on the state of another Quantitative Trait Loci (QTL). For instance sum of functions for positions plus error term.
Genotype and Phenotype Covariation: Gene Mapping Decay of local dependency Time Reich et al. (2001) Genetype -->Phenotype Function Dominant/Recessive Penetrance Spurious Occurrence Heterogeneity genotype phenotype Genotype Phenotype Sampling Genotypes and Phenotypes Result:The Mapping Function A set of characters. Binary decision (0,1). Quantitative Character.
D r r M D M Pedigree Analysis & Association Mapping Association Mapping: Pedigree Analysis: 2N generations Pedigree known Few meiosis (max 100s) Resolution: cMorgans (Mbases) Pedigree unknown Many meiosis (>104) Resolution: 10-5 Morgans (Kbases) Adapted from McVean and others
Heritability: Inheritance in bags, not strings. The Phenotype is the sum of a series of factors, simplest independently genetic and environmental factors: F= G + E Relatives share a calculatable fraction of factors, the rest is drawn from the background population. This allows calculation of relative effect of genetics and environment Heritability is defined as the relative contribution to the variance of the genetic factors: Parents: Has been been defined for 2 characters simultaneously to define common factors Siblings:
PIN based model of Interactions Emily et al, 2009 & Rhzetsky et al. Gene 1 Gene 2 3*3 table Phenotype i SNP 1 SNP 2
Summary of this lecture Data Concepts G - genetic variation GF Mapping T - transcript levels Models: Networks P - protein concentrations Hidden Structures/ Processes M - metabolite concentrations Knowledge F – phenotype/phenome Evolution GF Mapping General Function Enormous Used for Disease Gene Finding Can Include Biological Knowlede