Download
1 / 17
200 likes | 486 Views
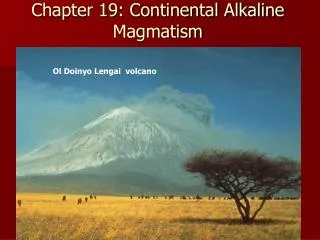
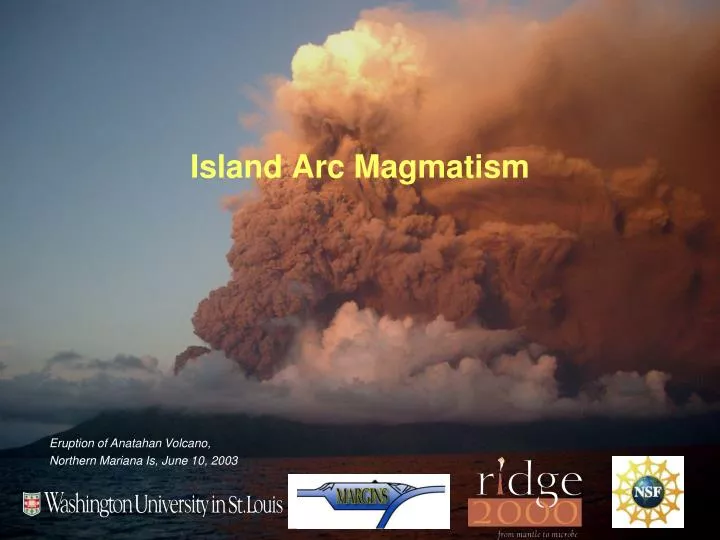
Island Arc Magmatism. Eruption of Anatahan Volcano, Northern Mariana Is, June 10, 2003. Subduction Factory. Arc lavas contain signature of subducted sediments. Decompression Melting. This model includes a backarc spreading center and shows contours of decompression melt production.

E N D
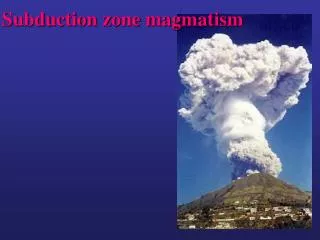
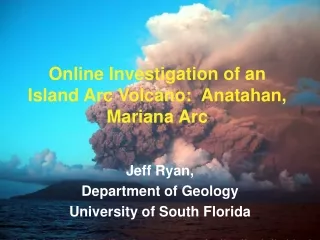
Island Arc Magmatism Eruption of Anatahan Volcano, Northern Mariana Is, June 10, 2003
Decompression Melting This model includes a backarc spreading center and shows contours of decompression melt production Conder et al., 2002
Mantle water as a function of distance from the Trench Kelley et al [2006]
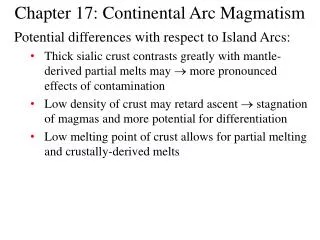
Modeling water transport and magma productionin the arc • Water is extremely important in arc processes • Water produces flux melting in the hot part of the arc • One goal of geophysical imaging is to provide constraints on these processes Cagniocle et al., 2007
Ocean Bottom Seismographs (OBS) Long Term Lamont-Doherty OBS OBS deployment from R/V Kaiyo, June, 2003
1994 Tonga-Lau 2003-2004 Mariana Seismic Studies of Arc-Backarc Systems Joint US-Japan project 58 OBSs deployed for 11 months 20 land broadband stations 30 OBSs recording for 3 months 11 land broadband stations
Comparison with Basalt Geobarometry = maximum anomaly • Si & Mg thermobarometry suggest a final equilibration depth of magma: 21-34 km for the backarc spreading center 34-87 km for the volcanic arc [Kelley et al., in press] • Corresponds perfectly with the strongest anomalies beneath the backarc and arc • Shows that velocity and Q anomalies delineate the melt production region • Anomalies result from small fractions of in-situ melt
Comparison of P Velocity and Attenuation Anomalies • The images are generally very similar • Attenuation image shows backarc anomaly narrower and centered on the spreading ridge • Some differences in the forearc
Comparison to Resistivity Structure fromOcean Bottom MT Survey Matsuno, Seama et al., in press • High conductivity above the slab up to depths of 60 km beneath the arc • Suggests the presence of connected melt and/or other fluids • Low conductivity beneath the spreading center • Any melt beneath the spreading center is disconnected or distributed discontinuously along the ridge
Seismic and Geochemical Evidence for Mantle Flow - Lau Shear wave splitting Helium isotope anomalies Mantle flow diagram Smith et al., [2001] After Turner and Hawkesworth, 1998
Nicaragua vs Costa Rica Attenuation – More Water? Rychert et al. [2008] • Nicaragua shows significantly higher attenuation than Costa Rica • Geochemical/petrologic constraints suggest similar mantle temperatures • The greater attenuation is consistent with higher mantle water contents and extents of melting inferred from geochemistry and melt inclusions.
Nicaragua Attenuation & Vp/Vs Ratio – evidence of magma ascent? Attenuation (from Rychert et al. 2008) Vp/Vs ratio (from Syracuse et al. 2008)