Download
1 / 1
10 likes | 81 Views
Descriptive title that conveys the overall focus of the project. Authors.

E N D
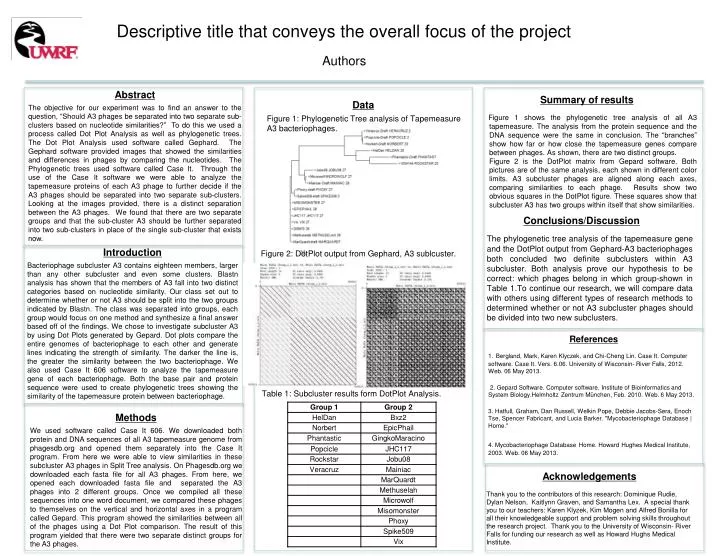
Descriptive title that conveys the overall focus of the project Authors AbstractThe objective for our experiment was to find an answer to the question, “Should A3 phages be separated into two separate sub-clusters based on nucleotide similarities?” To do this we used a process called Dot Plot Analysis as well as phylogenetic trees. The Dot Plot Analysis used software called Gephard. The Gephard software provided images that showed the similarities and differences in phages by comparing the nucleotides. The Phylogenetic trees used software called Case It. Through the use of the Case It software we were able to analyze the tapemeasure proteins of each A3 phage to further decide if the A3 phages should be separated into two separate sub-clusters. Looking at the images provided, there is a distinct separation between the A3 phages. We found that there are two separate groups and that the sub-cluster A3 should be further separated into two sub-clusters in place of the single sub-cluster that exists now. Summary of results Figure 1 shows the phylogenetic tree analysis of all A3 tapemeasure. The analysis from the protein sequence and the DNA sequence were the same in conclusion. The “branches” show how far or how close the tapemeasure genes compare between phages. As shown, there are two distinct groups. Figure 2 is the DotPlot matrix from Gepardsoftware. Both pictures are of the same analysis, each shown in different color limits. A3 subcluster phages are aligned along each axes, comparing similarities to each phage. Results show two obvious squares in the DotPlot figure. These squares show that subcluster A3 has two groups within itself that show similarities. Data Figure 1: Phylogenetic Tree analysis of Tapemeasure A3 bacteriophages. Conclusions/Discussion The phylogenetic tree analysis of the tapemeasure gene and the DotPlot output from Gephard-A3 bacteriophages both concluded two definite subclusters within A3 subcluster. Both analysis prove our hypothesis to be correct: which phages belong in which group-shown in Table 1.To continue our research, we will compare data with others using different types of research methods to determined whether or not A3 subcluster phages should be divided into two new subclusters. Introduction Bacteriophage subcluster A3 contains eighteen members, larger than any other subcluster and even some clusters. Blastn analysis has shown that the members of A3 fall into two distinct categories based on nucleotide similarity. Our class set out to determine whether or not A3 should be split into the two groups indicated by Blastn. The class was separated into groups, each group would focus on one method and synthesize a final answer based off of the findings. We chose to investigate subcluster A3 by using Dot Plots generated by Gepard. Dot plots compare the entire genomes of bacteriophage to each other and generate lines indicating the strength of similarity. The darker the line is, the greater the similarity between the two bacteriophage. We also used Case It 606 software to analyze the tapemeasure gene of each bacteriophage. Both the base pair and protein sequence were used to create phylogenetic trees showing the similarity of the tapemeasure protein between bacteriophage. Figure 2: DotPlot output from Gephard, A3 sublcuster. References 1.Bergland, Mark, Karen Klyczek, and Chi-Cheng Lin. Case It. Computer software. Case It. Vers. 6.06. University of Wisconsin- River Falls, 2012. Web. 06 May 2013. 2. Gepard Software. Computer software. Institute of Bioinformatics and System Biology.HelmholtzZentrumMünchen, Feb. 2010. Web. 6 May 2013. 3. Hatfull, Graham, Dan Russell, Welkin Pope, Debbie Jacobs-Sera, Enoch Tse, Spencer Fabricant, and Lucia Barker. "Mycobacteriophage Database | Home." 4. Mycobacteriophage DatabaseHome. Howard Hughes Medical Institute, 2003. Web. 06 May 2013. Table 1: Subcluster results form DotPlot Analysis. Methods We used software called Case It 606. We downloaded both protein and DNA sequences of all A3 tapemeasure genome from phagesdb.org and opened them separately into the Case It program. From here we were able to view similarities in these subcluster A3 phages in Split Tree analysis. On Phagesdb.org we downloaded each fasta file for all A3 phages. From here, we opened each downloaded fasta file and separated the A3 phages into 2 different groups. Once we compiled all these sequences into one word document, we compared these phages to themselves on the vertical and horizontal axes in a program called Gepard. This program showed the similarities between all of the phages using a Dot Plot comparison. The result of this program yielded that there were two separate distinct groups for the A3 phages. Acknowledgements Thank you to the contributors of this research: Dominique Rudie, Dylan Nelson, KaitlynnGraven, and Samantha Lex. A special thank you to our teachers: Karen Klyzek, Kim Mogen and Alfred Bonilla for all their knowledgeable support and problem solving skills throughout the research project. Thank you to the University of Wisconsin- River Falls for funding our research as well as Howard Hughs Medical Institute.