Download
1 / 13
130 likes | 254 Views
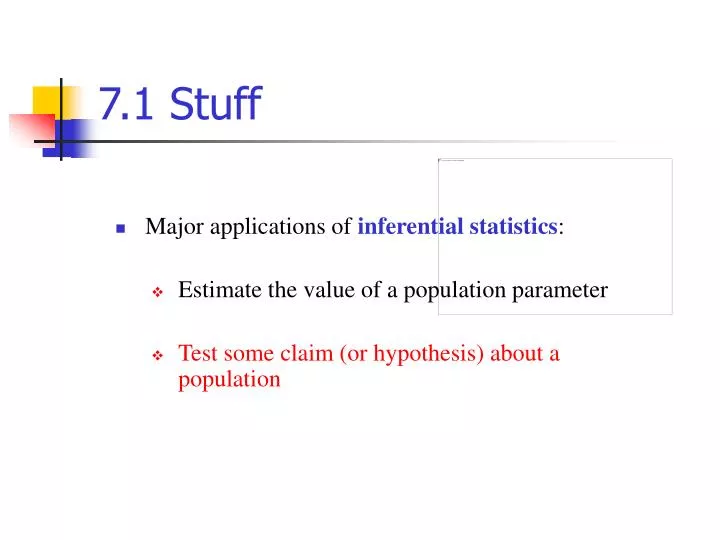
7.1 Stuff. Major applications of inferential statistics : Estimate the value of a population parameter Test some claim (or hypothesis) about a population. 7.1 Stuff. A statistical hypothesis is a claim or statement about a population parameter.

E N D
7.1 Stuff • Major applications of inferential statistics: • Estimate the value of a population parameter • Test some claim (or hypothesis) about a population
7.1 Stuff • A statistical hypothesis is a claim or statement about a population parameter. • A hypothesis test is a process that uses sample statistics to test a claim about the value of a population parameter.
7.1 Examples • A university publicizes that the proportion of its students who graduate in 4 years is 82%. • A water faucet manufacturer announces that the mean flow rate of a certain type of faucet is less than 2.5 gallons per minute. • A cereal company advertises that the mean weight of the contents of its 20-ounce size cereal boxes is more than 20 ounces.
7.1 Stuff • A null hypothesis H0is a statistical hypothesis that contains a statement of equality, such as . • The alternative hypothesis Ha is the complement of the null hypothesis. It is a statement that must be true if H0 is false and it contains a statement of strict inequality, such as .
7.1 Examples • A university publicizes that the proportion of its students who graduate in 4 years is 82%. • A water faucet manufacturer announces that the mean flow rate of a certain type of faucet is less than 2.5 gallons per minute. • A cereal company advertises that the mean weight of the contents of its 20-ounce size cereal boxes is more than 20 ounces.
7.1 Stuff • A Type I error occurs if the null hypothesis is rejected when it is true. • A Type II error occurs if the null hypothesis is not rejected when it is false.
7.1 Stuff • In a hypothesis test, the level of significance is the maximum allowable probability of making a type I error. It is denoted by , the lowercase Greek letter alpha. • The probability of a type II error is denoted by , the lowercase Greek letter beta.
Population parameter Test statistic Standardized test statistic z (Section 7.2 n≥ 30) μ t (Section 7.3 n < 30) p z (Section 7.4) s2 χ2 (Section 7.5) 7.1 Stuff σ2
7.1 Stuff • If the null hypothesis is true, a P-value (or probability value) of a hypothesis test is the probability of obtaining a sample statistic with a value as extreme or more extreme than the one determined from the sample data.
7.1 Example • The proportion of drivers who admit to running red lights is greater than 0.5.
7.1 Example • The proportion of drivers who admit to running red lights is greater than 0.5. A survey of 880 randomly selected drivers showed that 56% of those respondents admitted to running red lights.
7.1 Stuff Decision Rule based onP-value • If , then reject H0. • If , then fail to reject H0.
7.1 Example • The proportion of drivers who admit to running red lights is greater than 0.5. A survey of 880 randomly selected drivers showed that 56% of those respondents admitted to running red lights. At the 5% level of significance, there is enough evidence to support the claim that the proportion of drivers who admit to running red lights is greater than 0.5.