Download
1 / 67
670 likes | 802 Views
STAT131 Week 8 L1 Sampling Distributions, Z, t. Anne Porter alp@uow.edu.au. Introduction. How big does be in order for us to conclude that there is a lack of fit?.

E N D
STAT131Week 8 L1 Sampling Distributions, Z, t Anne Porter alp@uow.edu.au
Introduction • How big does be in order for us to conclude that there is a lack of fit? • How big does the difference in mean hand lengths between males and females have to be before we consider there to be a difference not due to chance? • It is as if by magic, rule,…. To look at these questions we examine the concept of sampling distributions
Sampling distributions • When we repeatedly sample from a population it is evident that there is variation in the various statistics that are computed. • This is the nature of sampling (chance) • Repeated samples give rise to a distribution of the statistics calculated for each of the samples ie a Sampling distribution
Sampling distributions These may be determined • Theoretically • Empirically (through simulation)
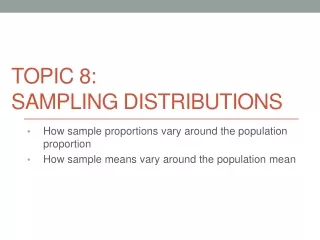
Sampling Distributions: Formal • The distribution of all possible values that can be assumed by some statistic (eg mean, variance), computed from samples of the same size randomly drawn from the same population, is called a sampling distribution of that statistic.
Distribution of Means • When the mean is calculated for samples of the same size from a population there are some important results.
Central Limit Theorem(Large Sample Normality) • Given a random sample X1, X2, ..Xn from any distribution with mean and finite variance 2, then irrespective of the distribution of the parent population, the distribution of approaches the shape of a normal distribution when the sample size is large, with a mean and standard deviation irrespective of sample size.
frequency 1 0 2 4 6 8 10 12 Population Values Activity 1: • Given the population of values (N=7) with values 0,2,4,6,8,10,12, plot the distribution. How would you describe the shape?
frequency 1 0 2 4 6 8 10 12 Population Values Activity 1: • Given the population of values (N=7) with values 0,2,4,6,8,10,12, plot the distribution. How would you describe the shape? Uniform except that this is discrete not continuous
Relative frequency 0.14 0 2 4 6 8 10 12 Population Values Activity 1: • How else may we have plotted the population - rather than using frequency? Use relative frequency ie divide frequency by total number
Mean of draw1 and draw2 Draw 2 Draw 1 • Find the sampling distribution of all means, for all samples that can be drawn with replacement and of size 2 (n=2) from the population: 0,2,4,6,8,10,12 0
Mean of draw1 and draw2 Draw 2 Draw 1 3 4 5 6 7 8 9 4 5 6 7 8 9 10 5 6 7 8 9 10 11 6 7 8 9 10 11 12 • Find the sampling distribution of all means, for all samples that can be drawn with replacement and of size 2 (n=2) from the population: 0,2,4,6,8,10,12 0 1 2 3 4 5 6 7 2 3 4 5 6 7 8 1 2 3 4 5 6
Draw 2 Draw 1 0 1 2 3 4 5 6 7 2 3 4 5 6 7 8 3 4 5 6 7 8 9 4 5 6 7 8 9 10 5 6 7 8 9 10 11 6 7 8 9 10 11 12 1 2 3 4 5 6 • Find the frequency of each mean Means 0 1 2 3 4 5 6 7 8 9 10 11 12 Freq 1
Draw 2 Draw 1 0 1 2 3 4 5 6 7 2 3 4 5 6 7 8 3 4 5 6 7 8 9 4 5 6 7 8 9 10 5 6 7 8 9 10 11 6 7 8 9 10 11 12 1 2 3 4 5 6 • Find the frequency of each mean Means 0 1 2 3 4 5 6 7 8 9 10 11 12 Freq 2 3 4 5 6 7 6 5 4 3 2 1 1
freq 7 6 5 4 3 2 1 0 Means 0 1 2 3 4 5 6 7 8 9 10 11 12 Freq 2 3 4 5 6 7 6 5 4 3 2 1 0 1 2 3 4 5 6 7 8 9 10 11 12 1 Means of samples Size 2 • Plot the frequency of each mean
freq 7 6 5 4 3 2 1 0 Means 0 1 2 3 4 5 6 7 8 9 10 11 12 Freq 2 3 4 5 6 7 6 5 4 3 2 1 0 1 2 3 4 5 6 7 8 9 10 11 12 1 Means of samples Size 2 • Plot the frequency of each mean
Means 0 1 2 3 4 5 6 7 8 9 10 11 12 Freq 1 2 3 4 5 6 7 6 5 4 3 2 1 Relative Freq • Find the sampling distribution of the means using relative frequency 1/49 2/49
means 0 1 2 3 4 5 6 7 8 9 10 11 12 Frequency 1 2 3 4 5 6 7 6 5 4 3 2 1 Relative Frequency 1/49 2/49 3/49 4/49 5/49 6/49 7/49 6/49 5/49 4/49 3/49 2/49 1/49 • Find the sampling distribution of the means using relative frequency
means 0 1 2 3 4 5 6 7 8 9 10 11 12 Relative Frequency 1/49 = 0.02 2/49 = 0.04 3/49 4/49 5/49 6/49 7/49 6/49 5/49 4/49 3/49 2/49 1/49 • Hence we have the sampling distribution of the means
rel freq 0 1 2 3 4 5 6 7 8 9 10 11 12 Means of samples Size 2 Plot the sampling distribution of means .14 .12 .10 .08 .06 .04 .02 0
rel freq 0.14 0.12 0.10 0.08 0.06 0.04 0.02 0 0 1 2 3 4 5 6 7 8 9 10 11 12 Means of samples Size 2 How can you describe the shape of the distribution?
rel freq 0.14 0.12 0.10 0.08 0.06 0.04 0.02 0 0 1 2 3 4 5 6 7 8 9 10 11 12 Means of samples Size 2 Symmetric, discrete (not bell shaped but is moving that direction from the original population. How can you describe the shape of the distribution?
Central Limit Theorem(Large Sample Normality) • Given a random sample X1, X2, ..Xn from any distribution with mean and finite variance 2, then irrespective of the distribution of the parent population, the distribution of approaches the shape of a normal distribution when the sample size is large, • with a mean • and standard deviation Then the distribution of the means should be normally distributed
Lab Task to show truth of central limit theorem using data • Given the population of values (N=7) with values 0,2,4,6,8,10,12, find the mean of the population. • Given the population of values (N=7) with values 0,2,4,6,8,10,12, find the mean of the means of all size two samples.
Finding:Mean of population and mean of the means are the same
Lab Task: Variance population (X) • Given the population of values (N=7) with values 0,2,4,6,8,10,12, find the variance of the population. • Given the sample means of size 2 of values with values 0,1,2,3,4,5,6,7,8,9,10,11,12, find the variance of the sample means.
Standard deviation of sample means Standard deviation of population scores From central limit theorem
When repeatedly sampling from normal populations one will note: • there is variability when we compare samples • the variability between samples is more evident for small samples than for large samples • the main characteristics of the sample summaries eg means remains similar. • outliers, clusters, skewness appear more apparent in small samples and hence larger samples are less likely to mislead • the larger the sample size the more stable the sample summaries tend to be.
Ex 1: Mean & Variance Exponential If samples of size 49 are simulated from the exponential distribution with a rate lambda of 1/3. • What is the variance and standard deviation of the population? Population distribution
Ex 1: Mean & Variance Exponential If samples of size 49 are simulated from the exponential distribution with a rate lambda of 1/3. • What is the variance and standard deviation of the exponential population? For an exponential So =3 or ==1/ So 2=Variance=9
Ex 2 Central Limit Theorem -shape If samples of size 49 are simulated from the exponential distribution with a rate lambda of 1/3. • What will be the shape of the distribution of the means of the samples? Distribution of population scores
Normal or bell shaped Sampling distribution of means Ex 2 Central Limit Theorem -shape If samples of size 49 are simulated from the exponential distribution with a rate lambda of 1/3. • What will be the shape of the distribution of the means of the samples? Distribution of population scores
Ex 2 Central Limit Theorem - mean If samples of size 49 are simulated from the exponential distribution with a rate lambda of 1/3. • What will be the mean of the of the sampling distribution of the mean?
Ex 2 Central Limit Theorem - mean If samples of size 49 are simulated from the exponential distribution with a rate lambda of 1/3. • What will be the mean of the of the sampling distribution of the mean? From the central limit theorem the mean of the sampling distribution equals the mean of the population The mean of an exponential is =1/ therefore and therefore
Ex 2: Central Limit theorem - variance If samples of size 49 are simulated from the exponential distribution with a rate lambda of 1/3. • What is the variance and standard deviation of the sampling distribution of means? Given we had the population standard deviation for the exponential
Ex 2: Central Limit theorem - variance If samples of size 49 are simulated from the exponential distribution with a rate lambda of 1/3. • What is the variance and standard deviation of the sampling distribution of means? From the central limit theorem the standard deviation of the sampling distribution is given by Hence the variance is 0.4292
Relative frequency 0.14 0 2 4 6 8 10 12 Population Values Reminder: • Even with a population shaped like this uniform discrete population when we plot the distribution of the means of all samples of size two we get….next slide
rel freq 0.14 0.12 0.10 0.08 0.06 0.04 0.02 0 0 1 2 3 4 5 6 7 8 9 10 11 12 Means of samples Size 2 Symmetric, discrete (not bell shaped but is moving that direction from the original population). As the sample size increases The distribution of the sample means is... we would expect this this to become closer to a normal curve
Z and T distibutions • Sampling distributions • Problems using Z (Normal, Gaussian) • Probability re Individual observations • Probability re means • Problems using T (T distribution) • Variance unknown, small sample but from a normal population • Variance unknown, large population
Sampling Distributions • The distribution of all possible values that can be assumed by some statistic (eg mean, variance), computed from samples of the same size randomly drawn from the same population, is called a sampling distribution of that statistic. • We can construct these distributions • by exhaustively taking all samples of a given size • by simulation taking a large number of samples
Method of sampling • With replacement or • Without replacement • The choice of method will result in a different distribution. • Sometimes the choice will make little difference • eg if the sample is small in relation to a large population
Activity 3 The mean and known standard deviation of serum iron values for healthy men are 120 and 15 micrograms per 100ml. What is the mean and standard deviation of the means for samples of size 49?
Activity 3 If the mean and known standard deviation of serum iron values for healthy men are 120 and 15 micrograms per 100ml, respectively what is the probability that a random sample of 49 normal men will yield a mean between 115 and 125 micrograms per 100 ml?
Activity 3 If the mean and known standard deviation of serum iron values for healthy men are 120 and 15 micrograms per 100ml, respectively what is the probability that a random sample of 49 normal men will yield a mean between 115 and 125 micrograms per 100 ml?
Z=-2.33 Z=2.33
.0099 P(Z<-2.33)= 1-.0099=0.9911 PZ<2.33=
P(115<X<125)=P(-2.33<Z<2.33)= P(Z<2.33)-P(Z<-2.33) =.9901-.0099 =.9802
Example 4 about single scores • A study of a large group of 8 year old female students at a state primary school has shown that they have an average IQ of 100 with a standard deviation of 10. (i) What is the probability that a girl selected at random from this group has an IQ of over 105?