Download
1 / 52
710 likes | 2k Views
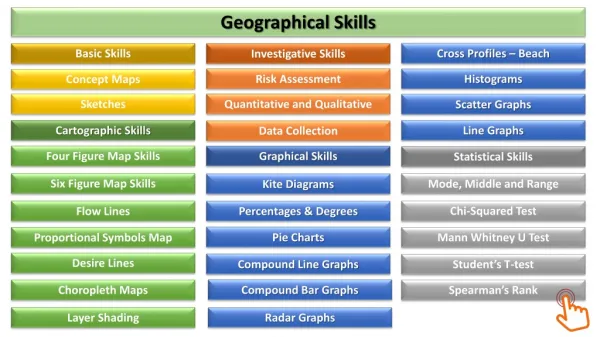
Year 9 Geographical Skills Revision. GEOGRAPHICAL SKILLS - SYLLABUS.

E N D
GEOGRAPHICAL SKILLS - SYLLABUS Geographical tools are to be integrated in teaching and learning in the mandatory courses and in the elective course. The use of information and communication technologies (ICT) with geographical tools will assist students to gather, analyse and communicate geographical information in appropriate formats. In Stage 5 students learn to use the Stage 5 geographical tools while continuing to incorporate the Stage 4 geographical tools.
WHAT DO WE NEED TO COVER? Maps • use various types of maps (physical, political, topographic, thematic) • identify and use elements of maps, including legend, direction, title, scale, border • distinguish between different types of map projections • distinguish between large-scale and small-scale maps • Use the scale of map to calculate distance • locate features using degrees and minutes of latitude and longitude, GR and AR • calculate the area of a feature • calculate the density of a feature • measure bearings on a map • calculate local relief (using shading, spot heights, colour and contour lines) • identify the aspect of a slope • construct a cross-section • calculate the gradient of a slope • construct a transect • read and interpret synoptic charts (wind direction/ speed, pressure patterns, fronts, rainfall)
WHAT DO WE NEED TO COVER? Fieldwork • features and uses of a compass to determine direction, clinometers and tape measure • features and uses of weather instruments, a Beaufort wind scale and cloud identification charts • features and uses of vegetation identification charts • Design interviews, construct surveys Photographs • Recognise different types of photos (oblique, aerial, ground-level photographs and satellite imagery) • draw a line drawing, undertake a field sketch • collect and interpret photographic images Graphs and Statistics • construct and interpret population pyramids • construct and interpret bar, column, line, climatic and proportional graphs • construct and interpret divided bar and column graphs, and composite line graphs • identify and calculate maximum, minimum, total, range, rank and average
MAP INTERPRETATION / TYPES OF MAPS • Maps are a representation of a part or whole of the Earth’s surface. As you should already know they can be done in different ways. There are various types of maps (physical, political, topographic, thematic).
MAPS AND FLOW CHARTS Flowline maps are designed to show movement. Arrows are used to show both the direction of movement and often the amount of the thing being moved.
This map is an example of a Choropleth map, shading of one colour is usually used to show equivalent areas. • OTHER TYPES OF MAPS The Thematic map show new businesses in the US are distributed using different colours.
BOLTS • B= BORDER - This is the feature around a map • O= ORIENTATION - Compass directions are vital for finding your way around a map. • L= LEGEND identify types of boundaries, roads, buildings, agriculture, industry, places of interest
BOLTS • = TITLE - This will give you a general idea about the information it stores. • S= SCALE - The scale of a map allows a reader to calculate the size, height and dimensions of the features shown on the map. The scale on a map is the ratio between real life sizes. The scale below is for a 1:50,000 scale map. At this scale, 1 cm on the map represents 50,000 cm on the ground (= 500 metres or 0.5 kilometres).
DIFFERENT TYPES OF MAP PROJECTIONS • The earth is a sphere, which is a three-dimensional (3‑D) shape. The most accurate method of representing the 3-D earth is to make a scale model of it called a globe. The 3-D earth can be represented on a two dimensional (2-D) surface by using a map projection where latitude and longitude are projected from the globe onto the flat surface. To do this, different parts of the globe have to be distorted. Map projections can be one or more—but never all—of the following: • equal area, where area is shown accurately • conformal, where shape is shown accurately • conical, where scale is shown accurately • true direction, where all directions are accurate • equidistant, where distance is accurate.
The scale on a map indicates how much a given distance on a map represents on actual land. Scale can be shown on a map in three different ways:1. As a linear scale, which is shown by a line divided into sections that represent a distance, You will need to use your ruler and then write determine the scale. The scale is 1cm is equal to 1000m, 1cm is equal to 1km. SCALE ON A MAP
SCALE ON A MAP 2. As a numeric scale, which is written as a ratio and is called a representative fraction (RF). A scale of 1:100, 000 means that 1 centimetre on the map represents 100 000 centimetres (or 1000 metres or 1 kilometre) on the ground. 3. As a sentence, for example: 1 centimetre represents 1000 metres or 1 centimetre to 1 kilometre. The scale of the map allows you to convert distance on the map to distance on the ground.
DIRECTION • You find the direction of one place from another by using the points of a compass. The four cardinal (main) points are north (N), south (S), east (E) and west (W). These points can be divided to form the 8-point and 16-point compasses. The 16 points of the compass give a general direction but sometimes more accuracy is needed.
Topographic map are a large scale map that shows the relief of the land and height above sea level using contour lines. Details such as walking tracks and even water tanks can be shown by symbols explained in the legend or key. • TOPOGRAPHIC MAP
TOPOGRAPHIC MAP • The lines on a topographic map form a grid pattern, which helps pinpoint locations, these are divided into numbered squares. • The grid squares created are usually one square kilometre in area These squares can be used to give a place a four or six-figure grid reference. It is important that you know both four-figure (AR) and six-figure (GR) references.
AREA AND GRID REFERENCE • When a grid is drawn on a map, the horizontal lines are called northings and the vertical lines are called eastings. • Eastingsare numbered from west to east. Northings are numbered from south to north. • Area reference (AR) a four-figure numerical location point made up of a two-figure eastings reading and a two-figure northings reading e.g. 0467 • Grid reference (GR) a six-figure numerical location point made up of a three-figure eastings reading and a three figure northings reading e.g. 045675. • Eastings are ALWAYS given before northings.
QUADRANT • Dividing up the map into 4 areas. NW, NE, SW,SE
Contours are lines on maps which indicate the land height above sea level.Contour lines that are close together indicate a steep slope, while contours that are widely spaced indicate a gentle slope. The shape of landforms can also be recognised from the pattern the contours make. CONTOUR LINES
CONTOUR LINES • Recognising a range of physical features from patterns made by contour lines does take practice. Two general rules are: • Where contour lines are far apart it means that the change in height over a given distance is small—it is a gentle slope • Where contour lines are close together it means that the change in height over a given distance is large— it is a steep slope
CROSS SECTION • Cross section looks at the land if it was sliced in half • Asked to complete cross section between two points
SPOT HEIGHTS • A spot height is indicated by a dot point and a number or a triangle and a height value. • Local Relief is the different in height on a line drawn between two points. • Aspect is the direction a slope is facing.
GRADIENT AND SLOPE • The gradient of an area is the vertical rise of slope over a given horizontal distance. To calculate the gradient of a slope between two points, use this simple formula: • Gradient = Horizontal distance (run) Difference in height (rise) • Rise/Run = 1200/30 = 40/1 = 1:40 • Gives us information regarding steepness of a slope • 1 metre incline for every 40 metres we walk
LATITUDE • Lines of latitude are imaginary lines that run around the earth’s circumference. They run parallel to each other and is measured in the number of degrees north (N) or south (S) of the equator, which is at 0 degrees (0°). The equator divides the earth into two parts—the northern and southern hemispheres. The latitude of the North Pole is 90°N and that of the South Pole is 90°S.
LONGITUDE • Longitude is measured in degrees east or west of the prime meridian, which runs through Greenwich in London, England, at 0°. Each line is called a meridian of longitude and is numbered east to west from the prime meridian at 0° around the earth to 180° (known as the International Date Line). They are NOT parallel to each other so all the lines meet at the North and South Poles.
LATITUDE AND LONGITUDE • Always write LATITUDE BEFORE LONGITUDE
LATITUDE AND LONGITUDE • Parallels of latitude: lines that run across the map from east to west; 5 main lines of latitude • Equator • Tropic of Cancer • Tropic of Capricorn • Arctic Circle • Antarctic Circle • Meridians of longitude: lines that run up and down the map from north to south; 2 main lines of longitude • The Prime Meridian at O ° • The International Date Line (IDL) which is around the 180 ° in the Pacific Ocean
FINDING PLACES USING LATITUDE AND LONGITUDE • Lines of latitude and longitude form a grid system, similar to Grid and Area References. The map below shows that New Zealand’s capital Wellington has a latitude of approximately 41°S of the equator and 174°E of the prime meridian.
SYNOPTIC CHARTS • Synoptic charts, are used to show the elements of the weather at a particular time of the day. Isobars are the lines on a weather map showing places of equal air pressure. Isobars enclose features called ‘cells’, which may be either high pressure or low pressure cells and shows the relationships between air pressure and wind direction/speed. • High pressure brings fine, clear stable weather • Low pressure bring cloudy unsettled weather with chance of rain • Winds around a high pressure system are anticlockwise (opposite in the Northern Hemisphere) • Winds around a low pressure system clockwise (opposite in the Northern hemisphere)
SYNOPTIC CHARTS • Low pressure systems – isobar numbers decrease towards the centre = unstable atmosphere, cloudy skies, rain and strong winds • High pressure system – isobar numbers increase towards the centre = gentle winds, clear skies, little chance of rain • Cold fronts – cold air overtakes warm air = temperature likely to fall, rain occurs and wind direction changes
SYNOPTIC CHARTS • Lines point to a location the way the wind is blowing • Wind direction named from where it comes • Wind speed measured by tail and key • The closer the isobars the stronger the wind
CLIMATE GRAPHS • A climatic graph is a graph that shows average temperature and precipitation (rainfall) for a location over a twelve-month period. It combines a line graph to show temperature with a column graph to show precipitation.
CLIMATE GRAPHS 1. Precipitation (rainfall) in columns 2. Temperature on lines 3. Temperature range = Highest minus lowest 4. Average annual rain fall = add up each of the12 months. 5. Note the difference between a Southern vs Northern hemisphere climate graph 6. Nth Qld map = hot dry winter, hot wet summer. 7. Southern Australia = 4 seasons
WEATHER INSTRUMENTS • A THERMOMETER measures the air temperature. • A BAROMETER measures air pressure. • A RAIN GAUGE measures the amount of rain that has fallen over a specific time period.
WEATHER INSTRUMENTS • A WIND VANE is an instrument that determines the direction from which the wind is blowing. • An ANEMOMETER measures wind speed. The cups catch the wind, turning a dial attached to the instrument
WEATHER INSTRUMENTS • The BEAUFORT SCALE is a measure that relates wind speed to observed conditions at sea or on land. • The CLOUD CHART includes cloud names such as cirrus, cumulus, stratus, altocumulus, altostratus, and cumulonimbus
TYPES OF PHOTOGRAPHS • Geographers use photos as a tool to identify and record geographic features and information. • The four main types of photos are: • ground photos • vertical aerial photos • oblique aerial photos • satellite images. • All types are valuable tools as sources of information that geographers use to make observations and decisions
TYPES OF PHOTOGRAPHS • Ground Photo – taken at ground level with the camera pointed horizontally
TYPES OF PHOTOGRAPHS • Aerial photographs • Vertical • Oblique
TYPES OF PHOTOGRAPHS • Satellite