Download
1 / 41
410 likes | 496 Views
Third quarter Results Francisco Arregui, General Manager. CONTENTS. Grupo Catalana Occidente. 1. Highlights. 2. Quartly information (3Q08). 3. Investments. 4. Solvency. 5. 1. Grupo Catalana Occidente. SEG. CATALANA. PREPERSA. CATOC VIDA. SALERNO 94. MENÉNDEZ PELAYO. OCCIDENTE.

E N D
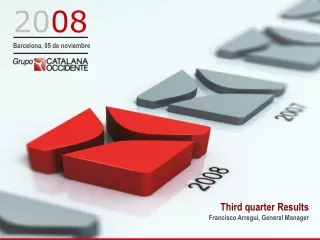
Third quarter Results Francisco Arregui, General Manager
CONTENTS Grupo Catalana Occidente 1 Highlights 2 Quartly information (3Q08) 3 Investments 4 Solvency 5
1 Grupo Catalana Occidente
SEG. CATALANA PREPERSA CATOC VIDA SALERNO 94 MENÉNDEZ PELAYO OCCIDENTE 100.00% 79.20% 100.00% 100.00% Fully consolidated companies 100.00% TECNISEGUROS SEGUROS BILBAO COSALUD CATOC SICAV 100.00% 99.72% 100.00% 84.09% BILBAO VIDA NORTEHISPANA BILBAO HIPOTECARIA 99.72% 99.78% 99.72% SEGUROS BILBAO S.ÓRBITA DEPSA FONDOS 99.72% 100.00% 99.72% GRUPO BILBAO TELEMARK ATRADIUS NV CRÉDITO Y CAUCIÓN 64.23% 99.72% 70.34% C.O. CAPITAL AGENCIA DE VALORES 100.00% Companies consolidated using the equity method HERCASOL SICAV BAQUEIRA BERET ASITUR ASISTENCIA 28.54% 33.82% 49.49% CALBOQUER INPISA DOS SICAV 20.00% 25.48% GESIURIS 26.12% GRUPO CATALANA OCCIDENTE Group’s structure INSURANCE SPECIALTY INSURANCE INVESTMENT OTHER INSURANCE COMPANIES RELATED COMPANIES COMPANIES MULTILINE COMPANIES COMPANIES Atradius NV is the parent company of their subsidiaries including Crédito y Caución, S.A. Change in consolidation method since January 2008
GRUPO CATALANA OCCIDENTE Overview of Grupo Catalana Occidente Over 140 years of history Stable strategy over time • Well – established insurer • Wide range of insurance services • Focused on profitable growth • Target market: individuals and SMEs • Strong national presence over 1,000 offices around 20,000 agents • Professional agency network
GRUPO CATALANA OCCIDENTE Volume evolution 2,036 1,936 1,862 1,730 5.2% 1,300 1,298 4.0% 7.6% 1,117 33.1% 0.2% 852 16.2% 31.1% 553 54.1% 12.2% 1999 2001 2002 2004 2005 2007 2003 2006 2000 (figures in million of euros) Growth history – multiplying by 3.7
GRUPO CATALANA OCCIDENTE Volume proforma evolution 3,125 1,936 1,862 1,730 62.0% 1,300 1,298 4.0% 7.6% 1,117 33.1% 0.2% 852 16.2% 31.1% 553 54.1% 12.2% 1999 2001 2002 2004 2005 2007 prof 2003 2006 2000 (cifras en millones de euros) Growth history – multiplying by 5.7
291.4 249.5 234.7 175.5 191.4 127.5 113.9 137.6 103.6 76.4 90.6 53.2 41.5 41.0 33.1 50.1 41.1 39.8 31.5 30.0 1999 2001 2002 2004 2005 2007 2003 2006 2000 Consolidated profit Consolidated profit IFRS Attributable profit Attributable profit IFRS (figures in million of euros) GRUPO CATALANA OCCIDENTE Demonstrating capacity for growth while improving profitability Attributed profit multiplied by 7.5
125% 120% 117.7% 115% 110.4% 109.3% 110% 108.2% 104.6% 104.7% 105% 102.3% 102.6% 101.2% 99.6% 99.9% 99.7% 100% 98.5% 99.1% 99.3% 95.7% 94.5% 95% MULTIRISK 92.7% 96.7% 92.6% 92.4% 90.8% 93.2% 95.0% 91.1% 92.7% 90.2% AUTO 91.0% 93.9% 90% 89.6% 91.8% 88.6% NON LIFE 88.3% 88.8% 87.3% 88.0% 87.7% 85% 87.4% 87.1% CREDIT 80.5% 82.7% 80% RESTOOF LINES 81.3% 79.7% 78.9% 78.4% 75% 1999 2000 2001 2002 2003 2004 2005 2006 2007 GRUPO CATALANA OCCIDENTE Combined ratio Combined ratio declined 20 points
4 7 GRUPO CATALANA OCCIDENTE Improving market position Ranking’s position 12/31/07 06/30/08 5 6.46% Multirisk 11 Auto 3.47% 6 5.12% Rest of Lines 1 60.5% Credit 5 4.64% Total Non-Life 15 2.37% Total Life 8 Total 3.69% Source: ICEA Figures of the Spanish market
2 Highlights
HIGHLIGHTS Inclusion of the Atradius Group Markets and economies’ situation
HIGHLIGHTS Inclusion of the Atradius Group Markets and economies’ situation
ESP ESP ESP GES GES CON CON CON GCO GCO GCO 100% 100% 7.8% 7.8% 41.2% 43.2% Previous situation CyC, SA SCO SCO SRe SRe DB DB SO SO 21.7% 28.2% 34.9% 12.8% 2.4% ATRADIUS N.V. ESP ESP ESP GES GES CON CON GCO GCO 8.5% 11.3% 9.9% 70.3% CyC (Holding) Current situation SRe DB SO 64.2% 25.0% 9.1% 1.7% ATRADIUS N.V. 100% CyC, SA INCLUSION OF THE ATRADIUS GROUP Transaction’s structure
60.5% 2,429 2,036 1,936 1,862 1,730 1,513 5.2% 1,300 1,298 4.0% 7.6% 1,117 33.1% 0.2% 852 16.2% 31.1% 553 54.1% 12.2% 1999 2000 2001 2002 2003 2004 2005 2006 2007 3Q07 3Q08 INCLUSION OF THE ATRADIUS GROUP Premiums evolution (figures in million of euros)
PP +MF 1% Multirisk Life 11% 18% Auto 14% Credit Rest of lines 48% 8% INCLUSION OF THE ATRADIUS GROUP Business Composition Geographic diversification Lines’ diversification
Combined ratio The value of GCO’s share HIGHLIGHTS Inclusion of the Atradius Group Markets and economies’ situation
125% 120% 117.7% 115% 110.4% 109.3% 110% 108.2% 106.4% CREDIT 104.6% 104.7% 105% 102.3% 102.6% 101.2% 99.6% 100% 99.9% 99.7% NON LIFE 98.5% 98.5% 99.1% 99.3% 95.7% 95% 94.5% 92.7% 95.0% AUTO 96.7% 92.6% 92.4% 90.8% 91.3% 93.2% 95.0% 91.1% 92.7% 90% MULTIRISK 90.2% 91.0% 93.9% 90.0% 89.6% 91.8% 88.6% 90.9% 88.3% 87.6% 85% 88.8% 87.3% 88.0% 87.7% 87.4% 87.1% 80% 82.2% 80.5% 82.4% 82.7% REST OF THE LINES 81.3% 76.0% 75% 79.7% 78.9% 78.4% 1999 2000 2001 2002 2003 2004 2005 2006 2007 3Q 3Q 2007 2008 MARKETS AND ECONOMIES’ SITUATION Combined ratio evolution
Combined ratio The value of GCO’s share HIGHLIGHTS Inclusion of the Atradius Group Markets and economies’ situation
Share price multiplied by 3.5 THE VALUE OF GCO’s SHARE Stock market performance 27.5 euros 22.9 euros 14.7 euros 14.2 euros 8.8 euros 4.9 euros 3.9 euros 2002 2003 2004 2005 2006 2007 11/04/08 Grupo Catalana Occidente Ibex 35 Dow Jones Europe Stoxx Insurance
27.5 22.9 14.7 14.8 14.2 12.4 12.4 12.9 11.1 8.8 8.6 4.9 4.3 4.0 5.6 3.3 3.1 3.9 3.4 3.5 3.2 2.8 1999 2000 2001 2002 2003 2004 2005 2006 2007 3Q08 11/04/2008 Book value plus properties’ unrealized capital gains per share Price per share THE VALUE OF GCO’s SHARE Book value
? Goodwill VIF non Life THE VALUE OF GCO’s SHARE Strong fundamental value Value of GCO’s per share 19.61 €/s 870.30 VIF Life (12/31/07)* 12.35 €/s 511.00 Properties’ unrealised capital gains 8.09 €/s Book Value 971.30 200 400 600 800 1,000 (million of euros) (euros per share) * Certified by Watson Wyatt 10/28/08 VIF – Value In Force
37.9% 31.8% DPS cagr: 16.7% 20.0% DPS evolution 10.0% 1.96 5.3% 3.3% 2.2% 1.60 1.15 Dividend improvement during last year 0.86 10% 0.42 0.48 0.34 0.25 0.40 0.29 0.22 0.20 0.182 0.200 0.19 0.19 Jul & Oct 2007 Jul & Oct 2008 2001 2002 2003 2004 2005 2006 2007 EPS DPS THE VALUE OF GCO’s SHARE Shareholder’s remuneration Constant and increasing policy CAGR – Compound Annual Growth Rate EPS – Earning per share DPS – Dividend per share
3 3Q08 Evolution Figures published in CNMV the 30th October 2008. Figures consolidated no audited.
(figures in million of euros) % CHG. 3rd. Q 2007 3rd. Q. 2008 % CHG. PRO - FORM Multirisk 271.0 280.0 3.3% Credit 320.1 1,169.1 265.2% 4.6% Rest of Lines 204.5 210.1 2.7% Auto 336.8 334.3 -0.8% Total Non-Life 1,132.4 1,993.4 76.0% 3.3% Total Life 380.9 435.6 14.4% Total Premiums 1,513.3 2,429.0 60.5% 5.1% Service Revenues 31.4 125.5 299.8% 3.1% TOTAL VOLUME 1,544.7 2,554.5 65.4% 5.0% Return on Investments 278.2 291.6 4.8% TOTAL REVENUES 1,822.9 2,846.1 56.1% 5.0% Pension Plan Contributions 43.0 49.7 15.6% Mutual Fund Contributions 24.4 -13.3 ----- PP + MF PP + MP 4% 1% Multirisk Multirisk 17% Total Life 11% Total Life 18% 25% Credit Auto 20% 14% Rest of Credit Auto Rest of Lines 47% 21% Lines 9% 13% THIRD QUARTER EVOLUTION Continuous growth of the income 3Q 2007 3Q 2008
100% 90% 85.0% 82.3% 81.5% CREDIT 80% 77.2% 78.5% 73.4% 73.0% 72.2% 71.5% 70.7% 69.5% 70% NON -LIFE 66.1% 71.7% 70.1% 69.9% 64.1% 68.6% 68.7% 68.0% 65.3% 62.2% 61.7% 59.3% AUTO 60.3% 60.7% 63.0% 62.2% 62.4% 60% 61.9% 61.1% 60.2% 60.7% 58.5% 58.5% 60.3% 57.2% 60.2% MULTIRISK 56,9% 57.6% 58.2% 58.0% 55.3% 55.9% 56.3% 56.3% 54.1% 54.2% 53.9% 53.7% 50% 52.3% 47.7% 47.2% 42.3% 40% REST OF LINES 40.0% 38.6% 30% 1999 2000 2001 2002 2003 2004 2005 2006 2007 3Q 3Q THIRD QUARTER EVOLUTION Claims ratio 2007 2008
(figures in million of euros) 3Q 2007 3Q 2008 % CHG. Multirisk 13.6 22.0 62.3% Rest of Lines 35.4 44.9 26.9% Auto 34.2 25.3 -26.0% Life 7.2 11.8 64.8% TECHNICAL RESULT AFTER EXPENSES 90.3 104.0 15.2% Investment income 47.2 49.4 4.7% TECHNICAL – FINANCIAL RESULT 137.5 153.4 11.6% Corporation tax 37.1 37.7 1.6% PROFIT ON ORDINARY ACTIVITIES 100.4 115.7 15.3% ATRADIUS & CyC PROFIT ON ORDINARY ACTIVITIES 97.4 -30.1 -130.9% NON RECURRING PROFIT 28.4 29.4 3.4% CONSOLIDATED PROFIT 226.2 115.0 -49.2% Profit attributed to the parent company 180.9 131.9 -27.1% Minorities 45.3 -16.9 ---- THIRD QUARTER EVOLUTION 3Q08 Profit and Loss Account
Equity at 12/31/07 1,533.9 Consolidated profit 3Q08 115.0 Dividends paid -59.8 Change in valuation adjustments -206.2 Inclusion of minorities from Atradius and CyC, SL 242.7 Change in consolidation 41.5 Other 0.0 Total changes in equity 133.2 Equity at 09/30/08 1,667.1 Financial debt 115.8 Equity post debt at 09/30/08 1,782.9 THIRD QUARTER EVOLUTION Change in equity Solid balance sheet (figures in million of euros) Unrealized capital gains on property assets 547.4 M€ (493.4 M€ at Dec. 2007)
4 Investments
INVESTMENTS Funds under management 8,028 M€ (+8.72% 3Q07) Equities 593.9 8.3% ? • Adequate portfolio diversification • Main investment in fixed income • Limited exposure to equities: blue chips • Mutual funds: Atradius – mainly fixed income • Other investments: subsidiaries and receivables from reinsurance Fixed income 3,525.3 49.2% Short term 864.5 12.1% Mutual Funds 810.4 11.3% 4.6% Other investments 328.3 Properties 1,038.4 14.5% Client risk 867.0 (figures in million of euros)
INVESTMENTS Fixed income diversification Equities 593.9 8.3% ? Corporate 2,144.6 Fixed income 3,525.3 49.2% Government 2,245.2 Short term 864.5 12.1% Mutual Funds 810.4 11.3% • More than 50% invested in Government* • Average rating AA • Significant position to short term 4.6% Other investments 328.3 Properties 1,038.4 14.5% Client risk 867.0 (figures in million of euros) * Moody’s sep’08: Credit Analysis Sovereign Spain – Spanish government rated as Aaa
INVESTMENTS Properties Equities 593.9 8.3% ? • Insignificant exposure to residential sector • More than 50% of properties valuated until July 2007 • Last valuations in line to previous • Values under review: Richard Ellis value > Inmoseguros value** • Other singular properties still in process of review Fixed income 3,525.3 49.2% Short term 864.5 12.1% Mutual Funds 810.4 11.3% Own use BOOK VALUE UNREALISED CAP. GAINS 4.6% Other investments 328.3 396.9 Prime * OWN USE OWN USE 147.4 € 911.9 249.5 Properties 1,038.4 14.5% On rent UNREALISED CAP. GAINS BOOK VALUE 641.5 ON RENT ON RENT 241.5 400.0 Other Client risk 867.0 126.5 (figures in million of euros) * Prime: singular buildings placed at the main Spanish cities as well as other buildings at emblematic zones ** Inmoseguros – DGS’s authorized agency
5 Solvency
Minorities Atradius and CyC,SL 242.7 1,667 Consolidated result 3Q08 115.0 Consolidation adjustments 41.5 1,534 1,343 Dividends -59.8 Change in valuation -206.2 986 521 293 2007 3Q08 2003 2004 2005 2006 SOLVENCY Strong capital position Stability and growth Figures in million of euros 2003 under PGC, rest under NIFF
Minimum capital requirement Available capital Excess capital SOLVENCY Solvency I (figures in million of euros) Grupo Catalana Occidente ex Atradius Grupo Catalana Occidente con Atradius 2,235.8 1,975.7 1,716.6 1,628.5 519.2 347.2 December 2007 3Q 2008
Minimum capital requirement Available capital Excess capital SOLVENCY Solvency I versus Solvency II at 12/31/07 (figures in million of euros) Grupo Catalana Occidente ex Atradius Grupo Catalana Occidente ex Atradius 2,121.9 1,975.7 1,628.5 1,497.4 624.5 347.2 Solvency II Solvency I
SOLVENCY Rating S&P considers GCO a strong capitalized company * A - Stable n.a. * A - Stable n.a. A Stable A2 A Stable A2 * Done to the main insurance companies of the Group by the segmented rating method
THE VALUE OF GRUPO CATALANA OCCIDENTE Solid and profitable business Credit: long term investment Conservative and prudent investment policy Insignificant financial debt Important excess capital
DISCLAIMER This presentation includes oral and written “forward-looking statements” with respect to certain plans and its current goals and expectations relating to its future financial condition, performance and results. These forward-looking statements represents a simple forecast whose formulation does not represent a guarantee with respect to the future performance of the Company. By their nature, all forward-looking statements involve risk and uncertainty because they relate to future events and circumstances which may be beyond the Company’s control such as general economic conditions, performance of financial markets, the frequency and severity of insured loss events, mortality and morbidity levels and trends, persistency levels, interest rate levels, currency exchange rates, general competitive factors, changes in laws and regulations, changes in the policies of governments or regulatory authorities. The Company undertakes no obligation to update the forward-looking statements made in this presentation or any other forward-looking statements.
THANK YOU FOR YOUR ATTENTION For further information please contact: 0034935820518 accionistas@catalanaoccidente.com www.grupocatalanaoccidente.com