Download
1 / 18
180 likes | 320 Views
Numerical Simulation of Atmospheric Loadings of Mercury from a Coal Fired Power Plant to Lake Erie. S. M. Daggupaty, C. M. Banic and P. Blanchard. Air Quality Research Division, Science and Technology Branch Environment Canada. Presented at 11th Conference on Atmospheric Chemistry

E N D
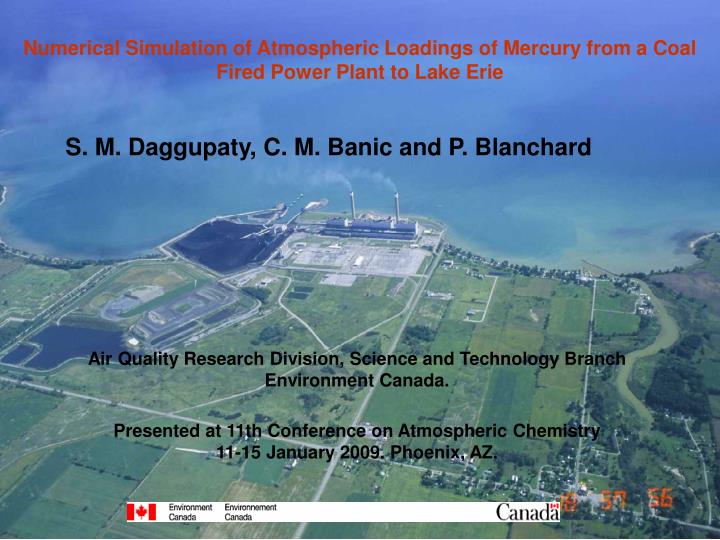
Numerical Simulation of Atmospheric Loadings of Mercury from a Coal Fired Power Plant to Lake Erie S. M. Daggupaty, C. M. Banic and P. Blanchard Air Quality Research Division, Science and Technology Branch Environment Canada. Presented at 11th Conference on Atmospheric Chemistry 11-15 January 2009. Phoenix, AZ.
BLFMAPS – Mesoscale Boundary Layer Forecast Model with Air pollution Prediction system. (Daggupaty. et al 2006) was used for simulations. • Deposition Fluxes: - Dry and Wet processes are formulated following Ma and Daggupaty (2000), Daggupaty et al (2006) and Zhang et al (2001, 2003). • Dry deposition flux (g m-2 s-1), is given by F(x, y)d = c(x,y,z1.5) vdeff (x, y) Ra bulk aerodynamic resistance is function of u*, z0 ,L. Rd quasi-laminar or surface resistance, Rc overall canopy resistance and Vg gravitational settling velocity.
Wet deposition flux (g s -1/ m2) : is the normalised scavenging coefficient (s-1 /mm hr-1) I is precipitation intensity (water equivalent in mm/hr). • For P-Hg the wet deposition flux is followed as in Daggupaty (2006). • For RGM (as of HNO3) =6* 10-4 • For GEM with its low solubility =3.0*10-6 • These are in agreement with Berg(2001), Petersen et al (1998) and Ryaboshapko et al (2004). • Adsorption at air – water interface was also estimated.
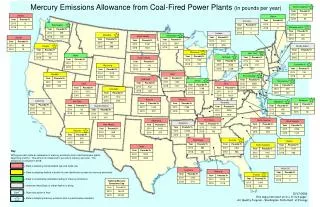
The annual average total Hg emission rate for the Nanticoke power plant varies between 4 to 8 mg/s (i.e., 130 to 240 kg/y) from NPRI data (National pollutant release inventory, http://www.ec.gc.ca/pdb/npri/npri_home_e.cfm). • In the year 2005 the annual average emission rate is 5 mg/s. 2. Particulate Hg mass is assumed to be in large, medium and small particle size bins with respective fraction of 80%, 5% and 15%. 3. The chemical transformation of the plume Hg. species over the travel period (~ 10 hr) of study domain is hard to anticipate and is not modeled in this study. Thus the plume could be undergoing different combinations of species strength over the travel period. The different scenarios considered here could be mimicking the plume evolution in time.
15.Urban 14. 13.Inland Water 12. 11.Wet land with plants 10. 9. 8. 7.Crops,mixed farming 6.Grass 5.Mixed leaf trees 4.Decds brdleaf trees 3.Decds Ndle Lf trees 2.Evergrn BrdLf trees 1.
Fig. 4a. Fig. 4b. Fig. 4c.
. Figure 5a . Figure 5b . Figure 5c
CONCLUSIONS • RGM is found to be the dominant contributor of the three species of Hg to the Lake Erie loading. • The scenario B (with 90% as RGM) emissions gives highest loading and it was about 15% of observed MDN value to the Lake Erie. • 98% of GEM emissions and 93% fine particulate Hg emissions were transported out of the circular area with 100km radius from the power plant. • 4. Our experiments also suggest that a case with a larger GEM portion of emission (about 90% of total Hg emission) will have the least amount of total Hg loading to the Lake Erie. • 5. It is prudent to mention that out of the four scenarios the aircraft measured Hg species configuration in the plume is that of scenario C and it has least impact with 3% of the observed total Hg wet deposition to Lake Erie.
Thank you. Any comments or ?