Download
1 / 18
200 likes | 460 Views
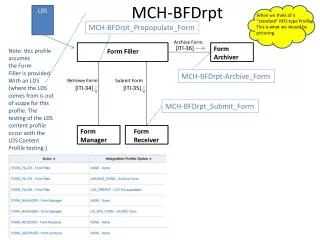
MCH Dashboard and Indicators. MCWH Quarterly Meeting 31 st January 2012 (The dashboard discussed but is still being finalised). MCH DHIS Dashboard. MCH DHIS Dashboard: Q1 and Q2, 2012/13. ANC visit before 20 weeks.

E N D
MCH Dashboard and Indicators MCWH Quarterly Meeting 31st January 2012 (The dashboard discussed but is still being finalised)
ANC visit before 20 weeks • Women who have a booking visit (first visit) before they are 20 weeks (about half way) into their pregnancy as a proportion of all antenatal 1st visits • Enumerator: Antenatal 1st visits before 20 weeks • Denominator: Antenatal 1st visits before 20 weeks + 20 weeks or later (All ANC bookings)
Post-natal care • Mothers who receive postnatal care within 6 days of delivery after discharge from place of delivery as proportion of all deliveries in facility • Enumerator: Postnatal care mother within 6 days from delivery • Denominator: Deliveries in facility
Vitamin A coverage (12-59 months) • Used as a proxy for access to PHC and community-based services • Rates in younger children are higher – but those in children 12 – 59 months have remained low.
Drop-out:DaPT-IPV-Hib3 – Measles 1 • The proportion of children who dropped out of the immunisation schedule between the third DTP-Hib or DTaP-IPV/Hib doses (normally at 14 weeks / 3.5 months) and the first measles doses normally at 9 months). The DTP-Hib or DTaP-IPV/Hib doses are used for this purpose. • Enumerator: DTP-Hib/DTaP-IPV/Hib 3rd doses - Measles 1st doses under 1 year • Denominator: DTP-Hib/DTaP-IPV/Hib 3rd doses Negative figures suggest problems with administering and recording doses of DaPT-IPV-Hib3
Conclusion • Despite some problems with quality of data, DHIS data allow MCWH performance at all levels to be tracked and monitored. • It is imperative that all health workers and managers engage with the DHIS data and use it to monitor and improve MCWH programmes and outcomes.
Definition of a dashboard • In management information systems, a dashboard is "an easy to read, often single page, real-time user interface, showing a graphical presentation of the current status (snapshot) and historical trends of an organization’s key performance indicators to enable instantaneous and informed decisions to be made at a glance." Peter McFadden
Targets: National vrs our district province NB Realistic
Reports and dashboards • Reports are a traditional way of summarizing data. They may include some visual components—such as graphs or charts but are text-heavy. • Dashboards are much more interactive in the way data is presented. Relying on visual indicators to display a simple, easily accessible interface that can be accessed by virtually anyone anywhere. -
Create dashboard • chandoo.org/wp/excel-dashboards • www.exceluser.com/dash/Cached • www.youtube.com/watch?v=6HDwYd-8ld8