Download
1 / 61
620 likes | 837 Views
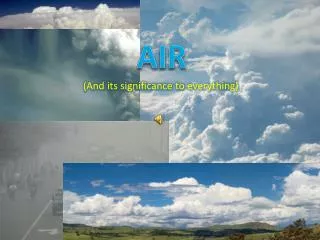
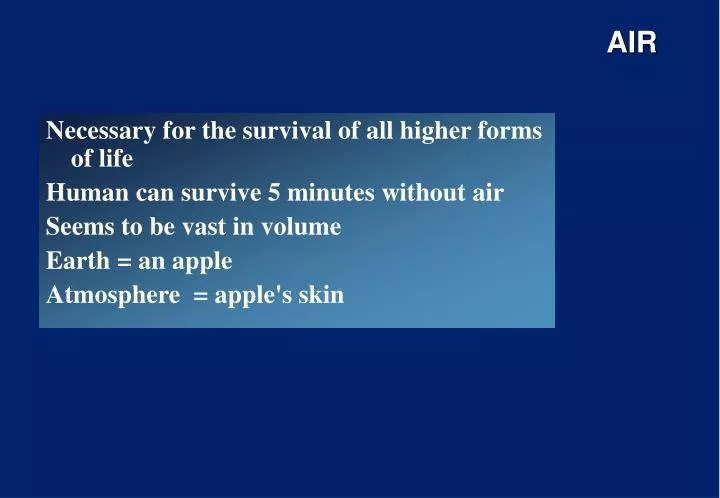
AIR. Necessary for the survival of all higher forms of life Human can survive 5 minutes without air Seems to be vast in volume Earth = an apple Atmosphere = apple's skin. 11-12. T. 284. 220. Kº. ATMOSPHERE. mixture of gases, liquid and solid aerosols small concentrations

E N D
AIR Necessary for the survival of all higher forms of life Human can survive 5 minutes without air Seems to be vast in volume Earth = an apple Atmosphere = apple's skin
11-12 T 284 220 Kº ATMOSPHERE • mixture of gases, liquid and solid aerosols • small concentrations • concentration and density decreases with the increase of altitude • energy of Sun photochemical reactions • presence of oxygen oxidation • troposphere (cloud-belt) • 11-12 km (poles: 8 km; Equator: 18 km) • T decreases • 1 ºC /100 m for dry air • 0.65 ºC /100 m under natural conditions • Air receives heat energy from the Earth • clouds, weather patterns, air pollution
180 80 M 50 ST 11-12 T 284 220 Kº = C + 273 ATMOSPHERE stratosphere • T increases • upward to an altitude of 50 km • most of the ozone can be found here • part of the UV radiation of the Sun is adsorbed here • contains only a small fraction of the total air mass (lower air density) mesosphere • T decreases • up to 80 km
3 cm pollutant - ppm = 3 m air CONCENTRATION solid, liquid and gas pollutants volume/volume, mass/mass, mass/volume µg/m3, depends on T and p constant V [cm3/mmol] molar volume of ideal gas (1 atm 101.3 kPa, 20 °C 22.4 l) M [mg/mmol] molar mass - conversion
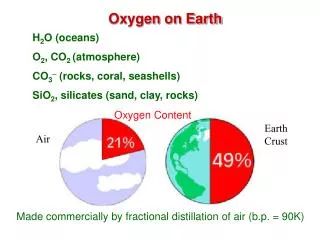
COMPOSITION OF THE ATMOSPHERE concentration residence time effect N278 % 108 year greenhouse (1) constant O2 21 % 5000 year Ar 0.93 % (2) variable CO2 320 ppm 10 year greenhouse CH4 1 ppm 5 year greenhouse H2 0.5 ppm 7 year N2O 0.3 ppm 8 year O3 (tr./str.) 10 ppb/1 ppm 2 year smog/filter
COMPOSITION OF THE ATMOSPHERE concentration residence time effect (3) Significantly variable CO 0.1 ppm 0.3 year toxic NO2 1 ppb 10 day acidification SO2 1 ppb 3 day acidification Water vapour (0.4-400)102 ppm 10 day (greenhouse) Freon (hal. hydrocarbons, pl. CF2Cl2) 100 year ozone depletion
HISTORY OF AIR POLLUTION • II. Edward (end of 13th c.): prohibits heating with coal • III. Richard (14-15th c.): smoke-tax • 17th c. London: move industrial areas, have green areas (proposal) • 1948 Donora (14 000 people), steel industry Pennsylvania) serious pollution • 1952 London smog • 1962 Los Angeles: photochemical smog • 1972 research on acid rain
AIR POLLUTION Contributing issues • DIURNAL CHANGE OF TEMPERATURE • ATMOSPHERIC STABILITY (INVERSION) • PLUME (convection and diffusion – wind speed and direction) • LAMINAR AND TURBULENT FLOW • MASS BALANCE (emission, reactions etc.)
ADIABATIC LAPSE RATE Atmospheric stability depends on the relationship between air temperature and altitude Troposphere: T decreases with increasing altitude Adiabatic lapse rate: boundary between stable and unstable atmosphere (-0.65ºC /100 m)
SUPERADIABATIC UNSTABLE The environment is in superadiabatic condition. If a volume of adiabatic gas is released into the air, it will behave in an unstable way. The gas will elevate or move to the ground depending on the relation between the air and the gas temperature. SUBADIABATIC STABLE The environment is in subadiabatic condition. If a volume of adiabatic gas is released into the air, it will behave in an stable way. The gas will gather in a small zone of height.
INVERSION Increase in temperature with altitude Most undesirable condition with respect to air quality Colder air is trapped below the warmer air – vertical movement of air masses is restricted No mixing or dispersion of air pollutants in an upward direction
Pollutants in the plume are mixed in the thin, unstable layer near ground, causing a condition of fumigation
SHAPE OF THE PLUME SUPERADIABATIC good mixing ADIABATIC INVERSION 1. little dispersion INVERSION 2. Inversion begins at a certain elevation – relatively thin layer of unstable air below – plume stop rising when reaching inversion layer
Example: 100 m chimney, 20 °C
WIND CONDITION Wind condition is the most important factor in the horizontal dispersion
MIXING - LAMINARAND TURBULENT FLOW -MIXING AND DIFFUSION DEPENDS ON THE METEOROLOGICAL CONDITIONS
value: - diagram - calculation sizing: Q, u known parameters aim: in x, y, z given limit Hight of the chimney?
TYPES AND SOURCES OF AIR POLLUTION • air pollution • presence of „foreign” substances in the atmosphere in high enough concentration, and for long enough duration to cause undesirable effects • natural air pollution • eruption of volcanoes • smoke and gases from forest fires • windblown dust from deserts • salt sea spray • pollen grains • pollution caused by industry, transportation and other human activities
TYPES AND SOURCES OF AIR POLLUTION • Primary pollutants: • released directly into the air in a harmful form • Secondary pollutants: • modified to a hazardous form after they enter the air or are formed by chemical reactions as components of the air mix and interact
TYPES AND SOURCES OF AIR POLLUTION • Mobile source • automobiles, air plains • Stationary source • coal fired electrical power stations • Different dispersion patterns • Different pollution control strategies
TYPES AND SOURCES OF AIR POLLUTION • Particulates • Sulfur dioxide • Nitrogen dioxide • Carbon monoxide • Hydrocarbons • Ozone • Lead
PARTICULATES • Small suspended fragments of solids or liquid droplets • 0,1 – 100 µm • < 1 µm particles tend to remain suspended in the air (smoke) • > 1 µm particles tend to settle (dust, mist) • Total suspended particulates > 10 million ton/year in USA
CARBON MONOXIDE incomplete combustion of fuels (automobiles) if the oxygen supply is insufficient, residence time is too short, temperature is too low 2 C + O2 2CO Colorless and odorless gas 100 million tons annually in the USA 70% from transportation
CARBON OXIDES predominant form is CO2 non-toxic increasing (0.4 % / year) global warming
NITROGEN OXIDES highly reactive gases during the combustion of fuels – reaction between atmospheric N2 and O2 N2 + O2 NO, NO2, NOx Red-brown toxic gas with sharp odor 20 million tons/year with water they form nitric acid (HNO3) - acidification
NITROGEN OXIDES 45% of the emission is anthropogenic 95% comes from fuel combustion in transportation and electric power generation ammonia from fertilizer and decaying matter is oxidized to NOx
HYDROCARBONS Compounds that consist of only H and C Natural sources (85%) – forests, decomposition of organic material Incomplete combustion, evaporation of gasoline from automobiles, industrial and chemical manufacturing processes Involved in atmospheric reactions that form secondary air pollutants Photochemical smog
SULPHUR COMPOUNDS • natural sources: • evaporation of sea spray • erosion of sulphate-containing dust from arid soils • fumes from volcanoes • biogenic emissions of hydrogen sulphide and org S containing compounds • 25% of the total flux is anthropogenic • in cities: 90% • Sulfur-dioxide is the main form of anthropogenic sulphur, mainly originating from electric power generation.
SULPHUR DIOXIDE fossil fuels (coal, oil) contain the element sulphur as impurity when sulphur is burned oxidation S + O2 SO2 colorless corrosive gas with sharp, choking odor primary pollutant (directly damages plants animals and humans) 27 million tons annually in the USA! China and USA are the largest sources!
1952 – London smog - 4000 deaths - maximum 2 mg/m3 0.75 ppm - SO2 (bronchitis) smoke, smog - inversion - synergic effects!!! WHO standard: 10’ 500 µg/m3 0.18 ppm 1 hour 350 µg/m3 0.125 ppm longterm 50 µg/m3 0.018 ppm
1962 Los Angeles: photochemical smog • automobiles, sunshine, high humidity • nitro-oxides, hydrocarbons • catalytic effect of sunshine new substances (secondary pollutants) e.g. ozone (toxic, stifling mist attacking the eye and nose, mycoderm)
primary and • secondary pollution NO2+UV+VOC+O2 NO2+O3+PAN+aldehydes - diurnal variation
0.2 0.38 0.76 4.0 100 µm Ultra violet (UV) Visible (V) near infrared (IR1) far infrared (IR2) shortwave long wave Sun Earth X-ray mikrowave GREENHOUSE EFFECT Electromagnetic spectra
GREENHOUSE EFFECT - GLOBAL WARMING • ADSORPTION OF LONG WAVES (EARTH - 243 W/m2) • CO2 12-17 µm, O3 9.6 µm, WATER VAPOUR 8 µm • GASES • CO2: • 270 ppm 350 ppm (since the industrial revolution) • USA is the largest polluter, emitting 25% of the overall anthropogenic CO2-emission - CH4 : production of rise, animal keeping (anaerobic digestion) - N2O : combustion, fertilizers (denitrification) • Fighting GHE – last stage: Kyoto protocol
OZONE • TROPOSPHERE - 10 %, 1 %/year increase - carcinogenic, considered as photochemical smog • STRATOSPHERE - 80-85%, decreasing • CHAPMAN MODELL (1930) O + O2 O3 UV radiation O + O3 2 O2 catalizator - NO, Cl, H • “OZONE HOLE” – The decrease of the stratopheric ozone concentration over the Earth’s poles during the polar spring • FREON - measured since - 1970
CFCs (Chlorofluorocarbons) produce Cl- ion if UV radiation Cl- + O3 ClO + O2 ClO + O3 ClO2 + O2 ClO2 Cl- + O2 1 Cl- consumes 2 O3 and again reforms to Cl- CCl2F2 + UV CClF2 + Cl2 Cl2 + O3 ClO + O2 NO + O3 NO2 + O2 NO2 + O NO + O2 PHOTODISSOCIATION OF FREON
DATA FROM NASA (1987 SEPT: OZONEANDCHLORINE MONOXIDE): OZONE HOLE
DEPLETION OF THE STRATOSPHERIC OZONE • Consequences: • The UV radiation reaching the Earth’s surface is increasing • skin cancer • suppression of the immune system • severe sunburn • accelerated skin aging • damage of the plants • degradation of polymers, plastics
soil E WET DEPOSITION DRY DEPOSITION • EMISSIONS - NOx 50-60 % transportation 50-60 % energy industry - SO2, - CO2 energy industry - CH4 automobiles, combustion, stock raising ACIDIFICATION MODEL SO2