Download
1 / 18
190 likes | 449 Views
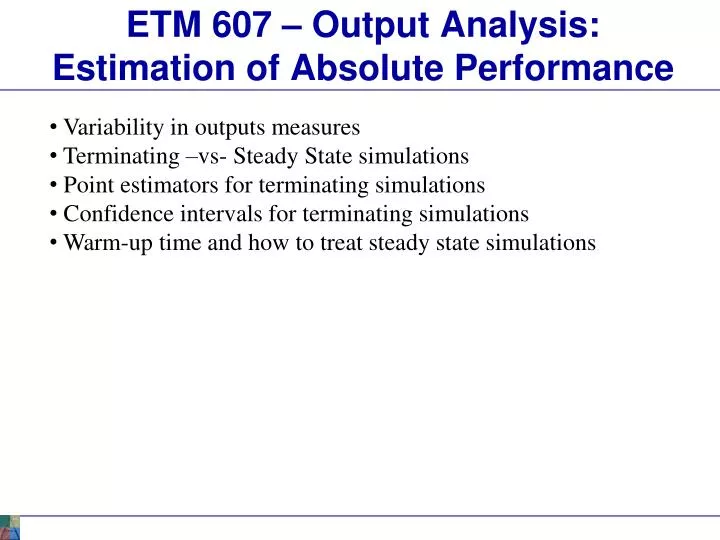
ETM 607 – Output Analysis: Estimation of Absolute Performance. Variability in outputs measures Terminating –vs- Steady State simulations Point estimators for terminating simulations Confidence intervals for terminating simulations Warm-up time and how to treat steady state simulations.

E N D
ETM 607 – Output Analysis: Estimation of Absolute Performance • Variability in outputs measures • Terminating –vs- Steady State simulations • Point estimators for terminating simulations • Confidence intervals for terminating simulations • Warm-up time and how to treat steady state simulations
ETM 607 – Variability in Output Measures Single Server Queue Arrival Rate ~Exp Service Rate ~ Norm • Performance Measures: • Average queue size • Max queue size • Average waiting time • Max waiting time • Average time in system • Max time in system • Server utilization • Number served
ETM 607 – Variability in Output Measures • Made a total of five runs of the simulation. • Total Production on each run was: • 5 • 3 • 6 • 2 • 3 • So which value for Production is correct?
ETM 607 – Variability in Output Measures • Made a total of five replications: Output Measures Absolute performance measures
ETM 607 – Terminating –vs- Steady State Simulation • Terminating Simulation • Distinct start and stop times for process • Tends to start with no entities in system and end with no entities • Examples: • Fast food • Bassett furniture door frame assembly cell • Evaluating manpower loading requirements for depot maintenance activity network. • Steady State Simulation • Process tends to run “forever” • Entities stay in the system between shift changes • Interested in long-term trends • Examples: • Assembly lines (Ford) • Evaluating WIP in depot maintenance • Warehouse operations (Double eagle steel) • Nashville glass floatline Output Analysis treated somewhat differently.
ETM 607 – Point Estimation For Terminating Simulation • Point Estimation – Terminating Simulation: Statistical mean or average or Tally Time-Persistent
ETM 607 – Point Estimation – Terminating Simulation • Point Estimation: Statistical mean or average or Tally Time-Persistent Which of the above performance measures are time-persistent and which are tally variables?
ETM 607 – Absolute Measure of Performance Estimation • Made a total of five replications: Sample mean or average Sample variance (S2) or standard deviation (S)
ETM 607 – Confidence Intervals • Confidence Interval (CI): • A measure of error. • The sample averages (Theta and Phi) and standard deviation (S) are estimates. • CI attempts to bound the error. • A confidence level (e.g. 95%=1-a) tells how much we can trust the true mean to be within the CI
ETM 607 – Confidence Intervals • Confidence Interval (CI): • A CI can be somewhat controlled when performing a simulation analysis. • How can we tighten the CI?
ETM 607 – Confidence Intervals • Confidence Interval (CI): • A CI can be somewhat controlled when performing a simulation analysis. • How can we tighten the CI? • Answer • Make more replications / runs (increase R) • Reduce S? How?
ETM 607 – Absolute Measure of Performance Estimation • Made a total of five replications: 95% Half Width
ETM 607 – Prediction Intervals • Prediction Interval (PI): • Similar to CI. • But to estimate, or predict a future outcome. • PI accounts for the natural variation in the process. • Cannot significantly “tighten” the interval by making more runs of the simulation. • Predicts the range of the output measure.
ETM 607 –Steady State Simulation • Terminating Simulation • Distinct start and stop times for process • Tends to start with no entities in system and end with no entities • Examples: • Fast food • Bassett furniture door frame assembly cell • Evaluating manpower loading requirements for depot maintenance activity network. • Steady State Simulation • Process tends to run “forever” • Entities stay in the system between shift changes • Interested in long-term trends • Examples: • Assembly lines (Ford) • Evaluating WIP in depot maintenance • Warehouse operations (Double eagle steel) • Nashville glass floatline Output Analysis treated somewhat differently.
ETM 607 – Steady State Models: Warm Up and Run Length • Most models start empty and idle • Empty: No entities are present at time 0 • Idle: All resources are idle at time 0 • In a terminating simulation this is OK if realistic • In a steady-state simulation, though, this can bias the output for a while after startup • Bias can go either way • Usually downward (results are biased low) in queueing-type models that eventually get congested • Depending on model, parameters, and run length, the bias can be very severe
ETM 607 – Steady State Models: Warm Up and Run Length • Remedies for initialization bias • Better starting state, more typical of steady state • Throw some entities around the model • Can be inconvenient to do this in the model • How do you know how many to throw and where? • This is what you’re trying to estimate in the first place! • Make the run so long that bias is overwhelmed • Might work if initial bias is weak or dissipates quickly • Let model warm up, still starting empty and idle • Run > Setup > Replication Parameters: Warm-up Period • Time units! • “Clears” all statistics at that point for summary report, any Outputs-type saved data from Statistic module of results across replications
ETM 607 – Steady State Models: Warm Up and Run Length • Warm-up and run length times? • Most practical idea: preliminary runs, plots • Simply “eyeball” them • Be careful about variability — make multiple replications, superimpose plots • Also, be careful to note “explosions” • Possibility – different Warm-up Periods for different output processes • To be conservative, take the max • Must specify a single Warm-up Period for the whole model
ETM 607 – Steady State Models: Warm Up and Run Length • Example Output Showing WIP over Time • No apparent explosion • Warm-up about 2000 min.; round up to 2 days (2880 min.) • Again make multiple replications like terminating simulation, but reset and start collecting statistics at time 2880.