Download
1 / 19
240 likes | 509 Views
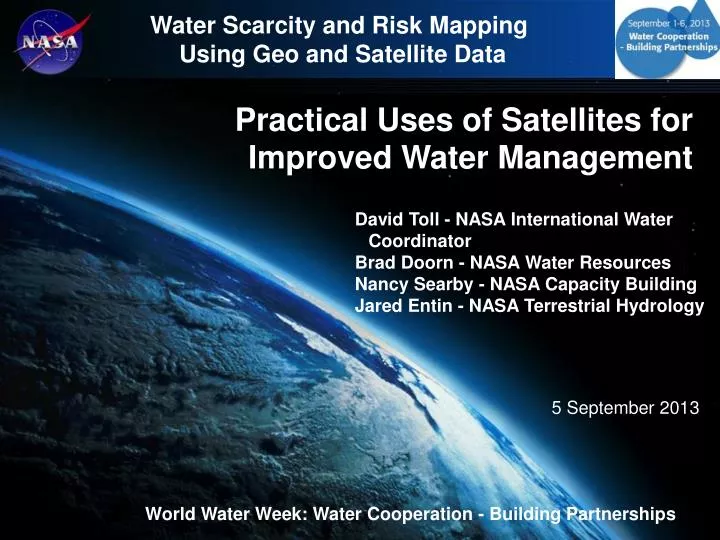
Water Scarcity and Risk Mapping Using Geo and Satellite Data. Practical Uses of Satellites for Improved Water Management. David Toll - NASA International Water Coordinator Brad Doorn - NASA Water Resources Nancy Searby - NASA Capacity Building Jared Entin - NASA Terrestrial Hydrology.

E N D
Water Scarcity and Risk Mapping Using Geo and Satellite Data Practical Uses of Satellites for Improved Water Management David Toll - NASA International Water Coordinator Brad Doorn - NASA Water Resources Nancy Searby - NASA Capacity Building Jared Entin - NASA Terrestrial Hydrology 5 September 2013 World Water Week: Water Cooperation - Building Partnerships
Towards Using Satellite Data for Water Challenges • Water Resources Challenges • Insufficient Surface Water Observations • Uncertainty in Water Data (Local to Global) • Climate Change & Population Growth • Satellite Based Solutions • NASA Free & Open Exchange of Data • Synoptic, Repetitive & Predictions (Model) • Satellite may be Integrated with In Situ & Model Data to estimate water availability. Predicted Climate Change Precipitation Inadequacy of Surface Observations Uncertainty in Water Availability Local to Global Scales Base climate projection downscaled by Maurer, et al.2007. Image from http://www.climatewizard.org/# River flow observations from the Global Runoff Data Centre. Warmer colors indicate greater latency in the data record. Does not Include Antarctica, Oki and Kanae, Science, 2006
Earth Science Missions in Operation Landsat-8
Precipitation from Space Tropical Rainfall Measurement Mission (TRMM) Global Precipitation Measurement (GPM) The GPM Core Observatory will provide improved measurements of precipitation from the tropics to higher latitudes • Global precipitation measurement (core) implemented with other satellites (50S-50N) • Active & passive radiometers • Critical water resources information • 1997 to present • Planned Feb 2014 launch • Inputs from constellation of satellites to increase space and time coverage: • - Better accuracy and coverage (to 6 km) • - Rain & snow observations every 3-hours with 3-hour latency (near real time) • - Longer record length • - High latitude precipitation (snowfall) TRMM 14-year mean rainfall
Soil Moisture Active Passive (SMAP) SMAP will provide global observations of mapped soil moisture & freeze/thaw data with unprecedented accuracy, resolution & coverage Objectives: • Global, high-resolution mapping ofsoil moisture and its freeze/thaw state to: • Extend weather and climate forecast skill • Improved flood and drought monitoring with predictions • Improve estimation for productivity (agriculture & natural) and evapotranspiration (consumptive water loss) • Engage end users and build support for applications Mission Implementation http://smap.jpl.nasa.gov/
GRACE Derived Terrestrial Water Storage Variations GRACE Science Goal: High resolution, mean and time variable gravity field mapping for Earth System Science applications Instruments: Two identical satellites flying in tandem orbit, ~200 km apart, 500 km initial altitude Key Measurement: Distance between two satellites tracked by K-band microwave ranging system Key Result: Information on water stored at all depths on and within the land surface Animation of monthly GRACE terrestrial water storage anomaly fields. A water storage anomaly is defined here as a deviation from the long-term mean total terrestrial water storage at each location. GRACE measures changes in total terrestrial water storage, including groundwater, soil moisture, snow, and surface water.
Emerging Trends in Global Freshwater Storage Trends in terrestrial water storage (cm/yr), including groundwater, soil water, lakes, snow, and ice, as observed by GRACE during 2003-12 Greenland’s ice sheet is thinning at a rate of up to 286 km3/yr Russian droughts in 2010 and 2012 Groundwater is being depleted across northern India at rate of about 54 km3/yr due to pumping for irrigation Alaska’s glaciers have been melting at 84 km3/yr Overexploitation of freshwater resources in the North China Plain Drought gave way to flooding in the Missouri River basin in 2011 Return to normal after wet years in early 2000s Recent and ongoing droughts in the southeastern U.S. and Texas Drought recovery and flooding Recovery from 2004-05 drought in the Amazon Depletion of water resources in Middle East exacerbated by drought Drought in southern Argentina and gravity step due to 2010 Maule Chile earthquake Return to normal in the Okavango Delta after drought ended in 2007 The western Antarctic ice sheet is thinning at a rate of up to 246 km3/yr Patagonian glacier melt GRACE observes changes in water storage caused by natural variability, climate change, and human activities such as groundwater pumping From Rodell/NASA-GSFC
Surface Water Mission Concept (SWOT) Stream Discharge and Surface Water Height • Motivation: • Critical water cycle component • Essential for water resource planning • Stream discharge and water height data are difficult to obtain outside US • Find the missing international, regional & continental discharge components Mission Concepts: Laser Altimetry Concept e.g. ICESat (GSFC) Radar Altimetry Concept e.g. Topex/Poseidon over Amazon R. Interferometer Concept (JPL) Targeted path Coincident w/ river reach Source: M. Jasinski/617
Integrating Remote Sensing Data with Modelingfor Local to Global Assessment of Water Resources Figure 1:Snow water equivalent (SWE) based on Terra/MODIS and Aqua/AMSR-E. Future observations will be provided by JPSS/VIIRS and DWSS/MIS. Figure 2:Annual average precipitation from 1998 to 2009 based on TRMM satellite observations. Future observations will be provided by GPM. Figure 5:Current lakes and reservoirs monitored by OSTM/Jason-2. Shown are current height variations relative to 10-year average levels. Future observations will be provided by SWOT. Figure 3: Daily soil moisture based on Aqua/AMSR-E. Future observations will be provided by SMAP. Figure 4:Changes in annual-average terrestrial water storage (the sum of groundwater, soil water, surface water, snow, and ice, as an equivalent height of water in cm) between 2009 and 2010, based on GRACE satellite observations. Future observations will be provided by GRACE-II. Peters-Lidard, NASA/GSFC
SW RADIATION PRECIPITATION MODIS SNOW COVER Data Integration Within a Land Data Assimilation System (LDAS) INTERCOMPARISON and OPTIMAL MERGING of global data fields Satellite derived meteorological data used as land surface model FORCING ASSIMILATION of satellite based land surface state fields (snow, soil moisture, surface temp, etc.) ACCESS ‘Global LDAS’ 3 hourly and monthly. Present - retrospectively (to 1948). 1.0° and 0.25° global grids. SNOW WATER EQUIVALENT Examples from NASA’s GLDAS http://ldas.gsfc.nasa.gov/ Matt Rodell NASA GSFC
Satellite Precipitation (Near Real Time) for Flood and Landslide Monitoring & Prediction
Remote Sensing: Water for Food • Mapping of Irrigated Lands • Uses unique spectral and temporal features • Global to field scale. Needs to be optimized locally. Useful for inventorying irrigated lands. Also map type, productivity & climate impacts • Global Agricultural Monitoring Program (GLAM) • Remote sensing based on using MODIS satellite data • Provides country risk and assessments with global monitoring and alerts. • Combines Agricultural Expertise (GEO, CoP, FAO), with Meteorological Expertise (WM0) and Earth Observational Expertise (CEOS) • Famine Early Warning System-Network • NASA & USGS assistance to USAID system • Produces ‘Water Requirement Satisfaction Index’ for rain-fed agriculture • Using NASA products and integrated modeling to expand to additional developing countries. • Extensive data sets, freely available (http://earlywarning.usgs.gov/) es Jordan Irrigation Mapping Ozdogan/UWisc Justice/UMd FEWS-NET Verdin/USGS
Satellite Based Drought Monitoring Systems (see http://wmp.gsfc.nasa.gov) NASA-USDA-Univ MD Global Cropland Drought Monitoring Using MODIS (Justice/U-MD) GRACE Satellite & Modeling for Ground Water Changes for Drought Monitoring (Rodell/NASA) ‘VEGDRI’ Using MODIS Satellite in Near Real time for Info to ‘County Level’ (Verdin/USGS) North American Drought Monitor NASA & USGS Assisting USAID with Famine Early Warning System, see http://earlywarning.usgs.gov (Verdin/USGS) Drought Monitoring for Brazil Using Cloud Computing Showing MODIS Derived Water Anomalies (May – July 2012) (Vivoni/ASU) Afghan Snow Pack Comparison Drought Monitoring ‘NOAA-USGS-NASA’ Central Asia Snow Pack Monitoring (Fall/NOAA) USDA-NASA Using AMSR-E for Crop Models for Horn of Africa Drought (Bolten/NASA) May 23, 2007 May 23, 2008
Satellite Data to Address Transboundary Water Issues NASA Project Lower Mekong with ‘MRC’ NASA Project Himalaya with ‘ICIMOD’ Flood Prediction Low Lying Deltas Himalayan Brown/NASA Bolten/NASA • Transboundary Water - Satellites & Modeling • Satellite - Multi-Scale (<100m – Global) • Near Real-time, retrospective (70’s), synoptic, with predictions (days to decades) • Integrated data system, including option for data assimilation • Free and open exchange of data including improved interoperability and visualization. Hossain/TennTech Regional Precipitation PERSIANN (Bolten/NASA) NASA-USAID East Africa SERVIR -CREST Model Regional Water Balance and Flooding MENA WISP NASA Nile Basin Project Zaitchik/JHU Limaye/NASA Bolten/GSFC
NASA Evapotranspiration Products are Contributing from Local to Global Applications NASA ET for Agriculture Water Consumptive Use. Landsat IR derived ET computed interactively by area. Product below developed for No. CO Conservancy District. Riverside Technologies. USDA-ARS ‘Alexi-DisAlexi’ for Regional to Local ET. Applied to Nile. {30m – 25km}. Wm-2 July Global Annual ET 2010-2010 Using MODIS. Q. Mu, U. Montana. Normalized Evaporative Stress Index, Anderson/USDA • ET can account for 90% of the semi-arid to arid water use and is critical to local economies tied to agriculture, recreation, hydro- power, etc. • Remote sensing is a ‘new’ and effective tool to map ET regionally and locally (<100 m).
Landsat, MODIS and AMSR-E: Snow-Cover and ‘SWE’ Maps SWE (mm)3001500 MODIS 5-km resolution snow map Using MODIS Data or Reconstruct SWE (Dozier/UCSB) AMSR-E SWE map MODIS Snow Cover to Hindu Kush 2007 8-day composite 0.05 resolution monthly composite 0.25 resolution Feb 24-Mar 2, 2004 2011 Reconstructed MODIS Snow Cover Foster et al., 2010 Snow Water Equivalent ~25-km resolution MODIS/AMSR-E Blended Snow (Foster/NASA) Percent snow cover
CLIMATE ASSESSMENT TOOL NASA Land Data Assimilation System 1979-present NLDAS2 Forcings and Parameters Noah, Catchment, SAC/Snow-17 Synthesis, Indicators SCA, SWE, TWS, SM, II • SCA (Snow Covered Area), SWE (Snow Water Equivalent), TWS (Terrestrial Water Storage), SM (Soil Moisture), II (Irrigation Intensity) • Assimilates NASA’s satellite soil moisture, snow water equivalent, snow cover area, terrestrial water storage & irrigation products to assess continental scale water budget including drought and floods. Examines long term water fluxes & provides effective ‘climate water indicators’.
Drought indicators for the Colorado River Basin from the Noah (v3.3) LSM within ‘LIS7’ using ‘NLDAS-2 forcing’ 2012 1979 The figures present indices used to characterize different types of drought. The standardized precipitation index (SPI) is a measure of meteorological drought, standardized runoff index (SRI) is a measure of hydrological drought, and standardized soil water index (SSWI) is a measure of agricultural drought. These indices are generated by fitting a gamma distribution to fit climatological time series data (precipitation for SPI, runoff for SRI, and root zone soil moisture for SSWI). Negative numbers indicate more severe droughts. The blue line and the gray shading indicate the domain average and spatial standard deviation for the Colorado Basin, respectively. These indices also confirm the 1990, early 2000s, and late 2011 droughts. Mild Moderate Severe Extreme Standardized Precipitation Index (SPI) Standardized Runoff Index (SRI) Standardized Soil Water Index (SSWI) Peters-Lidard/NASA
CONCLUSIONS • Theme of presentation – Highlight Use of Satellite Products and Information for Improved Water Resources Management. Especially Useful for Developing Countries. • Build on free and open exchange of satellite products. Range of tools and over a range of capacities. • NASA Applied Sciences is funding over 40 international (non-US) water projects with other groups (e.g., USAID& World Bank). • Includes major projects such as ‘SERVIR’, ‘FEWS-NET’, ‘MENA WISP’ & ‘GLAM’. • Also basin projects in the Nile Basin, Mekong Basin, & Himalayan Region. • Covers Them Areas: ‘Drought’, ‘Flooding’, ‘Water for Food’, ‘Consumptive Water Loss (ET)’, ‘Climate Impacts on Water’, ‘Water Allocation’ & ‘Transboundary’. • Most of techniques can be extended geographically to other regions. • Partnering - leveraging of resources and reducing redundancy is a key to help develop advanced technology tools for the more effective management of water resources.