Download
1 / 5
50 likes | 128 Views
Getting Started With STATA. How do I do this?. It probably opened automatically, but you may have to save it to the desktop, and double-click it to open it. How do I do this?. How do I do these things?. This one is easy! Pick one of the questions and type: Rename [oldname] [newname].

E N D
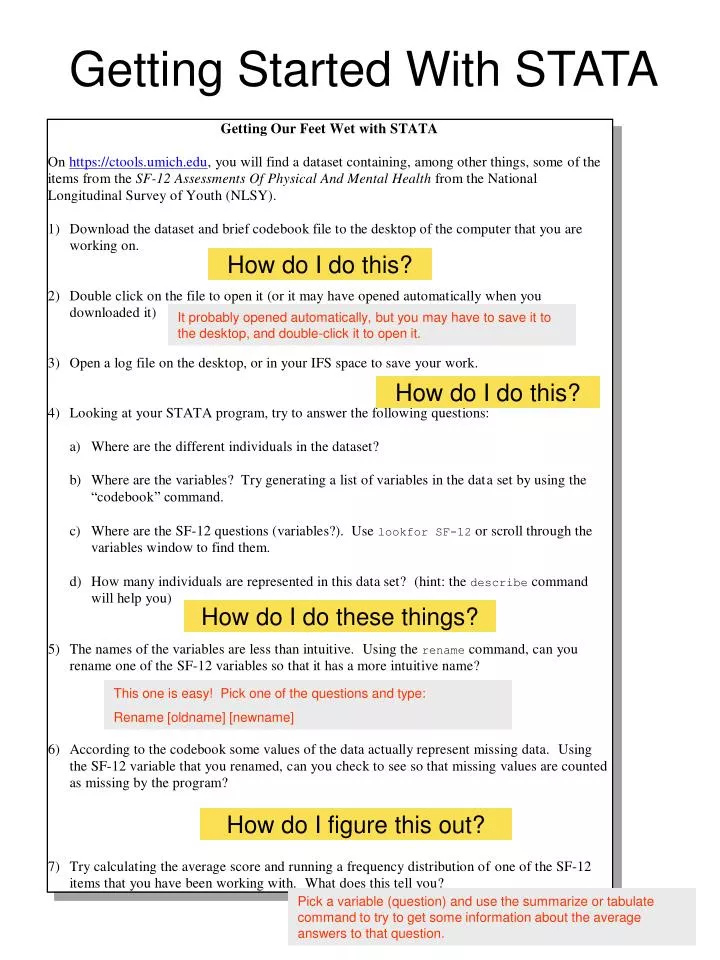
Getting Started With STATA How do I do this? It probably opened automatically, but you may have to save it to the desktop, and double-click it to open it. How do I do this? How do I do these things? This one is easy! Pick one of the questions and type: Rename [oldname] [newname] How do I figure this out? Pick a variable (question) and use the summarize or tabulate command to try to get some information about the average answers to that question.
Download the data set These .txt files are the codebooks Select NLSY.dta Return to Main Slide
Open a log file Log files are opened and closed with the little button that looks like a “scroll” next to a “stoplight” Return to Main Slide
Try to answer the following questions Return to Main Slide The spreadsheet containing rows of individuals, and columns of the questions they were asked, can be seen by clicking on the browse or edit data buttons • You can “lookfor” or “describe” certain variables (questions) • “describe, short” will give you information about the characteristics of the data, including the number of respondents The questions that were asked in the survey are just above
Return to Main Slide Missing Values This may strike you as a little bit complicated initially, but really, it’s a matter of common sense. Here’s an illustration of the problem: • The responses to many survey questions are coded in the following way • Agree 1 • Neutral 2 • Disagree 3 • Often, survey responses such as “don’t know”, “refused to answer”, “was not interviewed” are assigned a special numeric code indicating the non-response such as 99, -8, -9. • We will run into problems if we try to get an average value for this variable, because the codes for the missing responses will be averaged in with the codes for the actual responses, so we might get an average response of -90. • We have to tell the software (using the recode command) that these answers are in fact missing, and should be excluded from our calculations. • For many data sets, including the NLSY, this has already been done. • The symbol for missing values in most statistical software is a period (“.”).