Download
1 / 37
390 likes | 542 Views
Physics of Seawater. Water is …. a chemical compound (H 2 O) made up of two atoms of hydrogen and one atom of oxygen; in liquid state between the tempe-ratures of 0º C and 100º C; perhaps the only substance that is present in vast quantities in solid, liquid and gaseous states.

E N D
Water is … • a chemical compound (H2O) made up of two atoms of hydrogen and one atom of oxygen; • in liquid state between the tempe-ratures of 0º C and 100º C; • perhaps the only substance that is present in vast quantities in solid, liquid and gaseous states.
The water molecule • is light • is stable as liquid over a wide temperature-range • has high heat capacity and latent heat • freezes over, not under, and • is an excellent solvent
When water freezes to ice, the angle of hydrogen bonding expands from 105° to 109°. 105° - - - - - - - - - - - - - - - - - - - - + + + + + + + + + + + + 109° As the space taken by 27 water molecules is now used by 24 molecules, the density of ice is less than the density of water, i.e., water freezes over.
) 3 Density (g/cm Temperature (°C)
Salinity lowers water’s • freezing point • and • point of maximum density • and raises • the boiling • point. 1.03 1.02 Density (g/cm3) 1.01 Seawater therefore freezes at –2°C and boils at 103°C. 1.00 0.99 Temperature (°C)
The numbers for the density isoclinals here are the density factor [(= 1000 x (density – 1)] values, with density measured in gm/cm3. • Suppose we mix two water samples, X and Y, having different temperatures and salinities but the same density. What will be the temperature, salinity and density of the resulting mixture? • Where do we encounter such situations? 22 23 20° 24 25 Y 26 Temperature (°C) 10° 27 28 X 29 0° 31‰ 33‰ 35‰ 37‰ Salinity
Heat versus Temperature • Heat, the energy needed to change the temperature of a body, can be specific (i.e., temperature change at constant phase or state) or latent (i.e., state or phase change at constant temperature). • 25 cal of heat will change 1 g water vapor at 100°C to 1 g water vapor at 150°C • = ½50°C1g (Specific Heat) • This example shows how much heat is needed to change the temperature of 1 g ice at -50°C to 1 g cal g°C Water vapor at 150°C. F 150 • 540 cal of heat will change 1 g water at 100°C to 1 g water vapor at 100°C = 540 1g (Latent Heat) • The following changes occur in this process cal g D E 100 • ice from -50°C to 0°C (this involves specific heat) • ice to water at 0°C (this involves latent heat) • water from 0°C to 100°C (this involves specific heat) • water to water vapor at 100°C (this involves latent heat) • water vapor from 100°C to 150°C (this involves specific heat) This is the temperature range for liquid water Temperature measures the thermal state of matter • 100 cal of heat will change 1 g water at 0°C to 1 g water at 100°C • = 1 100°C1g (Specific Heat) Temperature (°C) 50 cal g°C B C 0 • 80 cal of heat will change it from 1 g ice at 0°C to 1 g water at 0°C, i.e., 80 1g (Latent Heat) 0 200 400 600 800 cal g • 25 cal of heat will change it to 1 g of ice at 0°C = ½ 50°C1g (Specific Heat) A -50 Heat (calories) cal g°C Let us use the following constants: Specific Heat = 1 for water and ½ for ice/vapor Latent Heat = 80 cal/g to melt ice 540 cal/g to boil water • Start with 1 g of ice at -50°C cal g°C Heat is the energy needed to change the temperature of a body or material (e.g., 1 calorie is the heat needed to change the temperature of 1 gram of water by 1°C) cal g°C Therefore, Total heat needed = (25+80+100+540+25) or 770 calories
Why do we have seasons? • NASA’s Earth Seasons Northern hemi-sphere Southern hemi-sphere • The 23½° tilt of Earth’s spin axis means that the two poles do not get the same amount of solar heat at the same time. • North pole is tilted toward the sun from about March 22 to about Sept 22, when south pole tilts away from the Sun. Vernal equinox Summer solistice Autumnal equinox Winter solistice March 21 June 22 Sept 22 Dec 22 March 21 Dec 22 Sept 22 June 22 • Do tropics have seasons? • Would seasons exist if the Earth’s spin axis was not inclined at all? • Northern hemisphere thus has its longest day (or summer solistice) around June 22, and the shortest day (or winter solistice) around Dec 22, whereas the opposite occurs in the southern hemisphere. • Seasons typically characterize the temperate latitudes (23½°– 66½° N and S), therefore, whereas tropics receive Sunlight all year round. Source: http://vortex.plymouth.edu/sun/sun3d.html
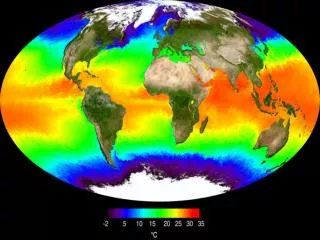
Seasonal temperature variations can be explained in terms of the latitudinal and seasonal variations in the surface energy balance. http://geography.uoregon.edu/envchange/clim_animations/gifs/tmp2m_web.gif
Depth: 0 Km http://ingrid.ldgo.columbia.edu/SOURCES/.LEVITUS94/.ANNUAL/html+viewer?plotcoast=draw+land
Depth: 0.05 Km http://ingrid.ldgo.columbia.edu/SOURCES/.LEVITUS94/.ANNUAL/html+viewer?plotcoast=draw+land
Depth: 0.1 Km http://ingrid.ldgo.columbia.edu/SOURCES/.LEVITUS94/.ANNUAL/html+viewer?plotcoast=draw+land
Depth: 0.2 Km http://ingrid.ldgo.columbia.edu/SOURCES/.LEVITUS94/.ANNUAL/html+viewer?plotcoast=draw+land
Depth: 0.5 Km http://ingrid.ldgo.columbia.edu/SOURCES/.LEVITUS94/.ANNUAL/html+viewer?plotcoast=draw+land
Depth: 1 Km http://ingrid.ldgo.columbia.edu/SOURCES/.LEVITUS94/.ANNUAL/html+viewer?plotcoast=draw+land
Depth: 2 Km http://ingrid.ldgo.columbia.edu/SOURCES/.LEVITUS94/.ANNUAL/html+viewer?plotcoast=draw+land
Depth: 3 Km http://ingrid.ldgo.columbia.edu/SOURCES/.LEVITUS94/.ANNUAL/html+viewer?plotcoast=draw+land
Depth: 4 Km http://ingrid.ldgo.columbia.edu/SOURCES/.LEVITUS94/.ANNUAL/html+viewer?plotcoast=draw+land
Depth: 5 Km http://ingrid.ldgo.columbia.edu/SOURCES/.LEVITUS94/.ANNUAL/html+viewer?plotcoast=draw+land
Therefore, thermocline (i.e., the inflection point in temperature-depth graph) is ... Temperature Tropical all year round, in summer at temperate latitudes. • permanent in the tropics; • seasonal at temperate latitudes, i.e., present in summer, missing in winter; and • absent in the polar waters. Depth Polar latitudes all year round, in winter at temperate latitudes
Global variations in sea surface salinity 24.0 33.0 34.0 35.0 36.0 37.0 38.0 18.0 30.0 32.5 33.5 34.5 35.5 36.5 37.5 42.0 Salinity in ‰ Source: http://oceanusmag.whoi.edu/v39n2/schmitt.html
Precipitation-Evaporation (P-E) represents the difference between precipitation and evaporation. Data: NCEP/NCAR Reanalysis Project. 1959-97 Climatologies Animation: Department of Geography, University of Oregon, March 2000(http://geography.uoregon.edu/envchange/clim_animations/gifs/pminuse_web.gif)
Surface salinity of the world ocean is high where evaporation exceeds precipitation, and low where the opposite holds. 50 Salinity Dry Evaporation - Precipitation (cm) 0 E - P Wet - 50 40°N 20°N 0° 20°S 40°S
Well defined and permanent haloclines therefore exist at the equator and at the 30°N and 30°S latitudes: Salinity (‰) • At the equator because high preci-pitation there makes the surface waters fresh/less salty. • At the 30°N and 30°S latitudes because excess evaporation there makes the surface waters very salty. Halo- cline Depth 30°N/S Equator
Sea Surface Temperatures http://www.scivis.nps.navy.mil/~braccio/images/T_big.gif
Sea Surface Salinity http://www.scivis.nps.navy.mil/~braccio/images/S_big.gif
Ocean Temperatures at 160m Depth http://www.scivis.nps.navy.mil/~braccio/images/E_big.gif
Ocean Salinity at 160m Depth http://www.scivis.nps.navy.mil/~braccio/images/A_big.gif
T-S plot for mapping the pycnoline Tabulated below are the temperature and salinity data obtained at different depths at about 10°N in the central Atlantic. Note how the data clearly show the presence of very salty and warmer waters at 700-800 m depths. Pycnocline is clearly present here (due to the influx of the Mediterranean waters). Indeed, there wasno need to plot the tem-perature, salinity and density depth-profiles separately to map this. Notice how easily this insight could be drawn from the T-S plot itself! 20 Depth (m) 100 200 300 400 500 600 700 800 900 1000 1100 1200 1300 1400 1500 Temp (°C) 15.0 14.2 12.1 10.0 9.0 8.0 13.2 12.7 6.4 4.9 4.0 3.5 3.0 2.6 1.5 Salinity (‰) 37.3 36.0 35.3 35.0 33.5 33.0 37.0 36.7 35.2 34.8 34.5 34.5 34.4 34.3 34.1 1.025 g/cm3 100 200 1.026 g/cm3 300 700 400 500 800 Temperature (°C) 10 1.028 g/cm3 600 900 1000 1.029 g/cm3 1.027 g/cm3 1100 1200 1400 1500 1300 0 32 34 36 38 Salinity (‰)