Download

1 / 35
360 likes | 661 Views
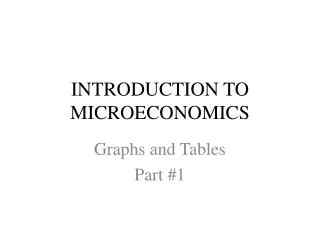
INTRODUCTION TO MICROECONOMICS. Graphs and Tables Part #2. Table III-1: The Market for CDs. Figure III-1.1: Calculating the Elasticity of Demand for CDs. P. a. $20.00. b. $18.00. f. $11.00. g. $9.00. D. e. $2.00. c. Q. $0.00. 0 10. 45 55. 90 100.

E N D
INTRODUCTION TO MICROECONOMICS Graphs and Tables Part #2
Figure III-1.1: Calculating the Elasticity of Demand for CDs P a $20.00 b $18.00 f $11.00 g $9.00 D e $2.00 c Q $0.00 0 10 45 55 90 100 Calculate ED for (1) Arc ab, (2) Arc ce, and (3) Arc fg
Figure III-1.2: The Demand Curve and Elasticity P ED > 1 $20 ED = 1 $10 ED < 1 Q 50 100 ED > 1 : Elastic Portion of the Demand Curve ED = 1: Unit Elastic Point on the Demand Curve ED < 1: Inelastic Portion of the Demand Curve
Figure III-1.3: Calculating the Elasticity of Supply for CDs P S $8.00 d $6.00 c $4.00 b $2.00 a Q 0 20 40 60 Arc a to b, ES = 3.0 (Why?) Arc b to c, ES = ? Arc c to d, ES = ?
Figure III-2: The Relation Between Total Revenue and Price P ED > 1 a $20.00 b $18.00 ED = 1 h $16.00 $10.00 ED < 1 k $4.00 e $2.00 c Q $0.00 0 10 20 50 80 90 100
Figure III-3.1: The Elasticity of Demand and the Ease of Substitution P $2.25 $2.00 D1 Q 500 1,000 Q = Crest Toothpaste
Figure III-3.2: The Elasticity of Demand and the Ease of Substitution D0 P $6 $2 Q 19K 20K Q = Gasoline
Figure III-4.1: The Elasticity of Demand and the Time Horizon DSR P Q
Figure III-4.2: The Elasticity of Demand and the Time Horizon P DLR Q
Figure III-5.1: Time Horizon as a Determinant of the Elasticity of Supply SSR P Q
Figure III-5.2: Time Horizon as a Determinant of the Elasticity of Supply P SLR Q
Figure III-6.1: The Final Burden of a Tax D0 P STAX=$20 S0 CB P1 = $86 WL P0 = $70 P2 = $66 $40 PB $20 Q Q1 = 920 1,000 = Q0 1350
UNDERSTANDING FIGURE III-6.1 • 1. Social Welfare Maximum at P0 = $70 and Q0 = 1,000 • 2. Impose Tax = $20, decrease in Supply • 3. New Equilibrium at P1 = $86 and Q1 = 920 • 4. Consumer Burden = CB = (P1 – P0)Q1 = ($86 -$70)920 = $14,720 • 5. Producer Burden = PB = (P0 – P2)Q1 = ($70 - $66)920 = $3,680 • 6. TaxRev = T (QTAX) = ($20) 920 = $18,400 = CB + PB • 7. WL = 1/2(80)($20) = $800 • 8. Note: In this situation the Welfare Losses are small (why?) and the Tax Revenues are large (why?).
Elasticity of Demand Calculation for the Final Burden of the Tax in Figure III-6.1 • ED= (5)(172)/1840 = 86/184
Elasticity of Supply Calculation for the Final Burden of the Tax in Figure III-6.1 • ESTAX = (20)(172)/1,840) = 344/184 • Conclusion: ESTAX > ED.Therefore______.
Figure III-6.2: The Final Burden of a Tax P STAX=$20 S0 $120 CB P1 = $80 WL P0 = $70 P2 = $60 $40 PB D1 $20 Q Q1 = 800 1,000 = Q0
UNDERSTANDING FIGURE III-6.2 • 1. Social Welfare Maximum at P0 = $70 and Q0 = 1,000 • 2. Impose Tax = $20, decrease in Supply • 3. New Equilibrium at P1 = $80 and Q1 = 800 • 4. Consumer Burden = CB = (P1 – P0)Q1 = ($80 -$70)800 = $8,000 • 5. Producer Burden = PB = (P0 – P2)Q1 = ($70 - $60)800 = $8,000 • 6. TaxRev = T (QTAX) = ($20) 800 = $16,000 = CB + PB • 7. WL = 1/2(200)($20) = $2,000 • 8. Note: In this situation the Welfare Losses are larger (why?) and the Tax Revenues are smaller (why?).
Figure III-7.4: The Demand for Illegal Drugs D P Q (a) Popular View P P P Q Q Q Casual Users Compulsive Users Market Demand (b) Economists’ View
Figure III-7.5: The Effect of Prohibition on the Market for Drugs in the Short-Run P S1 $200 S0 $2 D Q 10m 12m S0 = Legal Supply S1 = Illegal Supply
Figure III-7.7: The Legal Market for Drugs P S0 $2 D Q 12m S0 = Legal Supply
Figure III-7.8: The Illegal Market for Drugs D’ P D S1 $200 S0 $2 Q 10m 12m S0 = Legal Supply S1 = Illegal Supply
Figure IV-1: The Paper Mill and The Farmer The Paper Mill dumps its waste in the river and the Farmer downstream uses the polluted water to irrigate his fields. The damage to his crops is the external cost imposed involuntarily on the farmer. Paper Mill Question: Why does the Paper Mill dump its wastes in the river? River Farmer
Table IV-2: Effect of a Negative Externality on the Market for Paper
Figure IV-2.1 The Effect of a Negative Externality on the Paper Market P SSOC $120 SPVT P1 = $80 P0 = $70 $40 D $20 QPAPER Q1 = 800 1,000 = Q0
Figure IV-2.2 The Welfare Loss of a Negative Externality P SSOC $120 SPVT $90 P1 = $80 WL P0 = $70 $40 D $20 QPAPER Q1 = 800 1,000 = Q0 WL = ½(200)($90 - $70) = $2,000
Figure IV-2.3: Central Planning Hierarchy Politburo Council of Ministers GOSPLAN Output Quotas Input Information Industrial Ministries Output Quotas Input Information State-Owned Enterprises (SOEs)
Table IV-3: Illustrating the Coase Theorem • Assume the following: • D = Damages to the Farmer’s Crops from the Water Pollution produced by the Paper Mill • CPM = Costs to the Paper Mill to Install Pollution Control Equipment • CF = Costs to the Farmer of Cleaning the Water Used for Irrigation (Filters, Chemicals) • D = $20,000 CPM = $50,000 CF = $10,000 Farmer (F) Do Nothing Clean the Water (1) (2) F = $30,000 PM = $200,000 F = $40,000 PM = $200,000 Do Nothing Paper Mill (PM) Clean the Water (3) F = $50,000 PM = $150,000 F = Farmer’s Profits PM = Paper Mill’s Profits
Figure IV-3: The Four-Good Rectangle Degree of Exclusion Private Goods Common Pool Goods low high high Degree of Rivalry low Toll Goods Public Goods