Download
1 / 38
390 likes | 408 Views
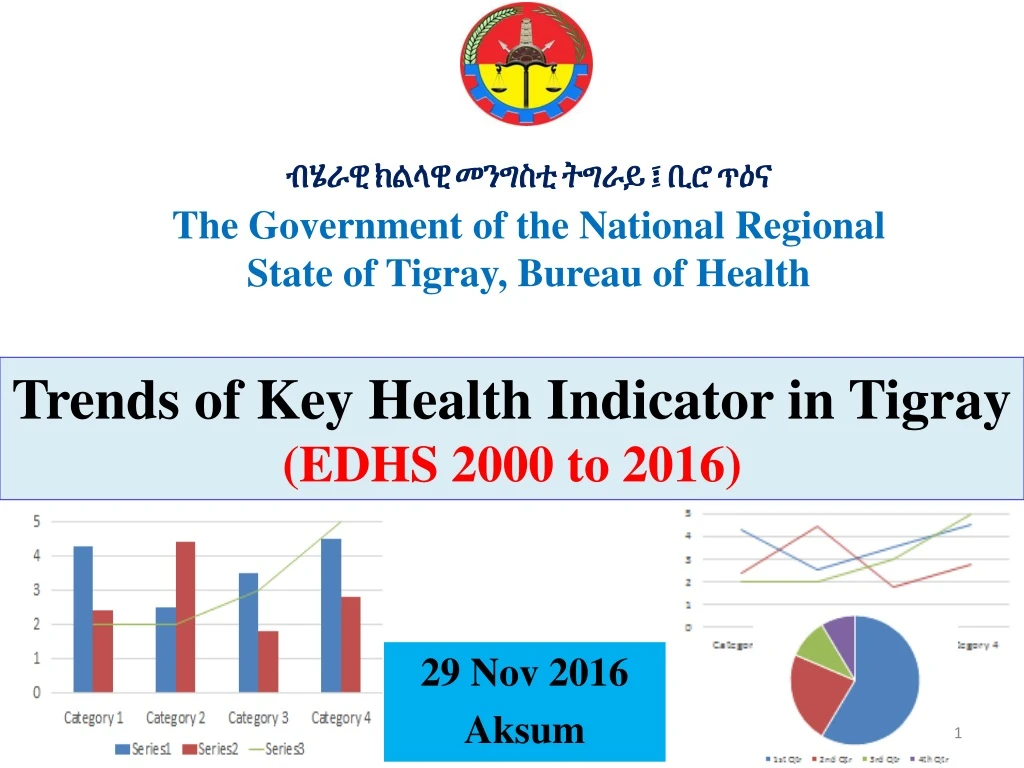
ብሄራዊ ክልላዊ መንግስቲ ትግራይ ፤ ቢሮ ጥዕና The Government of the National Regional State of Tigray, Bureau of Health. Trends of Key Health Indicator in Tigray (EDHS 2000 to 2016). 29 Nov 2016 Aksum. Outline. Objectives Introduction Maternal Health Child Health Nutrition Hygiene and Sanitation

E N D
ብሄራዊ ክልላዊ መንግስቲ ትግራይ ፤ ቢሮ ጥዕና The Government of the National Regional State of Tigray, Bureau of Health Trends of Key Health Indicator in Tigray (EDHS 2000 to 2016) 29 Nov 2016 Aksum
Outline • Objectives • Introduction • Maternal Health • Child Health • Nutrition • Hygiene and Sanitation • Gender • Mortality Figures • Way forward • Reference
1. Objective • To review the progress of selective health indicators in the last 20 years (using inter DHS data) • Help policy makers, Managers, experts and all stakeholders to make informed decisions for planning and interventions
2. Introduction • Ethiopia Demographic & Health Survey (EDHS) provides up-to-date estimates of key demographic and health indicators in Ethiopia • Commissioned by the FMOH of Ethiopia • Implemented by the Central Statistical Agency (CSA) and the DHS Program ICF, Rockville, Maryland, USA • Financially supported by the GoE and different International Agencies through the MoFEC • Conducted every five years since 2000 (1992 E.C) and captures the situation of about five years preceding the survey time[7 years for MMR]
2. Introduction . . . • There are only four DHS Reports for Ethiopia, the first was in 2000 (1992 E.C), and the recent was EDHS2016 • DHS Captures different social and health indicators • Only few indicators are considered in this presentation
3. Maternal Health: Family Planning (FP) Target: 55% (National STP) National Average: 35%
3. Maternal Health: FP . . . • The CPR in Tigray is similar with the national Average (35%) in EDHS2016 • The Unmet need in Tigray is less than the national average (18% Vs 22%)
3. Maternal Health: TFR • The average number of children a women can have in her reproductive age group • Tigray is relatively lower than the national average (2000, 2005, and 2011, but EDHS2016 do not show by regions yet) Target: 3 (National HSTP
3. Maternal Health: ANC 1+ • ANC1 (at least ONE visit) by Skilled Provider in Tigray showed significant improvement in the last 5 years (80% change of increase, or 40% absolute points) 40% points
3. Maternal Health: ANC 1+ . . . Target: 100% National Average 62%
3. Maternal Health: ANC 4+ Target: 95% (National HSTP • ANC 4+ (at least FOUR visits) is a measure of quality of care National Average 32%
3. Maternal Health: Skilled Delivery Increased by 57% points in 5 years (or nearly 6 folds)
3. Maternal Health: Skilled Delivery . . . . Target: 90% (National HSTP) National Average 28%
3. Maternal Health: Why Home Delivery? (EDHS2011)
3. Maternal Health: PNC, for Mother + Baby 32% points Target: 95% (National HSTP) National Average 17%
4. Child Health: Vaccination [Penta1 & 3] P3 DOR: 27% P3 DOR: 12% P1 reduced from 94% to 92%
4. Child Health: Vaccination [Measles & All Antigens] Reduction from 84% to 80%
4. Child Health: Vaccination [Measles] Target: 95% (National HSTP) National Average 54%
4. Child Health: Vaccination [All Antigens] Target: 95% (National HSTP) National Average 39%
5. Nutrition: Under5 Children, EDHS2016 Critical Time (6 to 24)
5. Nutrition: Stunting, Underweight, Wasting Target: 26% (National HSTP) Target: 4.9% (National HSTP) Target: 13% (National HSTP)
5. Nutrition: Stunting, EDSH2016 National Average 39% Target: 26% (National HSTP)
7. Gender . . . In ALL Thionic Groups, Age Groups; Across ALL Religious denominations, Educational status, Wealth quantiles and Residence
7. Gender: Teenage Pregnancy & Motherhood National Average 13% Target: 3% (National HSTP)
7. Gender: ObstetricFistula National Average 0.4%
8. Mortality: Under5, Infant, Neonatal Target: 20% (National HSTP) Target: 30% (National HSTP) Target: 10% (National HSTP)
8. Mortality: Under5, Infant, Neonatal • Under five year Morality Rate (U5MR); Infant (Under one year) Morality Rate (IMR);and Neonatal (Under one month) Morality Rate (NNMR)has reduced significantly over that last 20 years, • However, the pace of reduction is very slow among NNMR: According to EDHS2016, out of every 1000 live births, 29Neonates are dying within 28 days of Birth, other 19 Infants are dying within one months to one year (in 9 months), and the rest 19 children are dying during the rest 4 years time (1 to 5 year). Within the 1st ONE Month 29 19 Within 9 months 19 (Within 48 months) Out of the U5MR: 67/1000 LB in the EDHS2016
8. Mortality:Mothers • Maternal Mortality Ratio (MMR):the number of registered deaths among women, from any cause related to or aggravated by pregnancy or its management (excluding accidental or incidental causes) during pregnancy, childbirth or within 42 days of termination of pregnancy, irrespective of the duration or site of the pregnancy, for every 100,000 live births in a given year or period of time • One of the most sensitive indicators of socio-economic development of a nation!
8. Mortality Figures: MMR . . . . 199: Target (HSTP)
9. Summary • Some Health indicators in Tigray has showed significant improvement [EDHS 2011 Vs EDHS2016] • ANC1: nearly doubled in 5yrs (50% to 90%), but there is also missed opportunity for ANC4+ (57%) • Skilled delivery: increased by more than 5 folds, 12% to 69% • PNC: increased by more than 3 folds, 13% to 45%, but at lower rate than for skilled delivery (missed opportunity) • Some figures were high and kept to be high like Penta and Measles vaccines, >80% with marginal increment or even few reduction in EDHS2016 (Penta1 and Measles) • Some figures like Newborn morality, under5 malnutrition (Stunting) and Gender Based Violence have showed marginal decrease, still prevalent
9. Way forward . . .Hit while the Iron is hot: Act on the 4 Transformation agenda and the effective use of the HDA concept in PRACTICE! • Pillar1: Community • Empowered households/Mothers • Women Development Groups (WDGs) • Religious Leaders, Associations, and School community, etc. • Pillar3: Political Leadership • At Network level • Kebele Steering Committee (SC) and CP • Zonal and Regional Command Post (CP) • Pillar2: Government System (Health Care Structure) • HEW/HP as a PHCU • Hospitals • Private Sector • Sector bureaus, Agencies, • Development Partners • Etc. HDA
9. Way forward . . . Consolidate and Sustain the gains to date
Resource Management!!!!! Partnership!!! Resource Mobilization!!! 9. Way forward . . .
11. References • Central Statistical Agency [Ethiopia] and ORC Macro. 2001. Ethiopia Demographic and Health Survey 2000. Addis Ababa, Ethiopia, and Calverton, Maryland, USA: Central Statistical Agency and ORC Macro. • Central Statistical Agency (CSA) [Ethiopia] and ORC Macro. 2006. Ethiopia Demographic and Health Survey 2005. Addis Ababa, Ethiopia, and Calverton, Maryland, USA: Central Statistical Agency and ORC Macro. • Central Statistical Agency (CSA) [Ethiopia] and ICF Macro. 2012. Ethiopia Demographic and Health Survey 2011. Addis Ababa, Ethiopia, and Calverton, Maryland, USA: Central Statistical Agency and ICF Macro. • Central Statistical Agency (CSA) [Ethiopia] and ICF. 2016. Ethiopia Demographic and Health Survey 2016: Key Indicators Report. Addis Ababa, Ethiopia, and Rockville, Maryland, USA. CSA and ICF. • Godefay H, Abrha A, Kinsman J, et al. Undertaking cause-specific mortality measurement in unregistered population: an example from Tigray Region, Ethiopia. Glob Health Action. Glob Health Action. 2014;7. • TRHB. The Government of Tigray National Regional State Bureau of Health ten Years Health Bulletin (EFY 1998-2007). Mekelle, Ethiopia.: 2016.